Collective of the Invisible (Thesis, Coding)
Mentors: Sean Adams, Roy Tatum
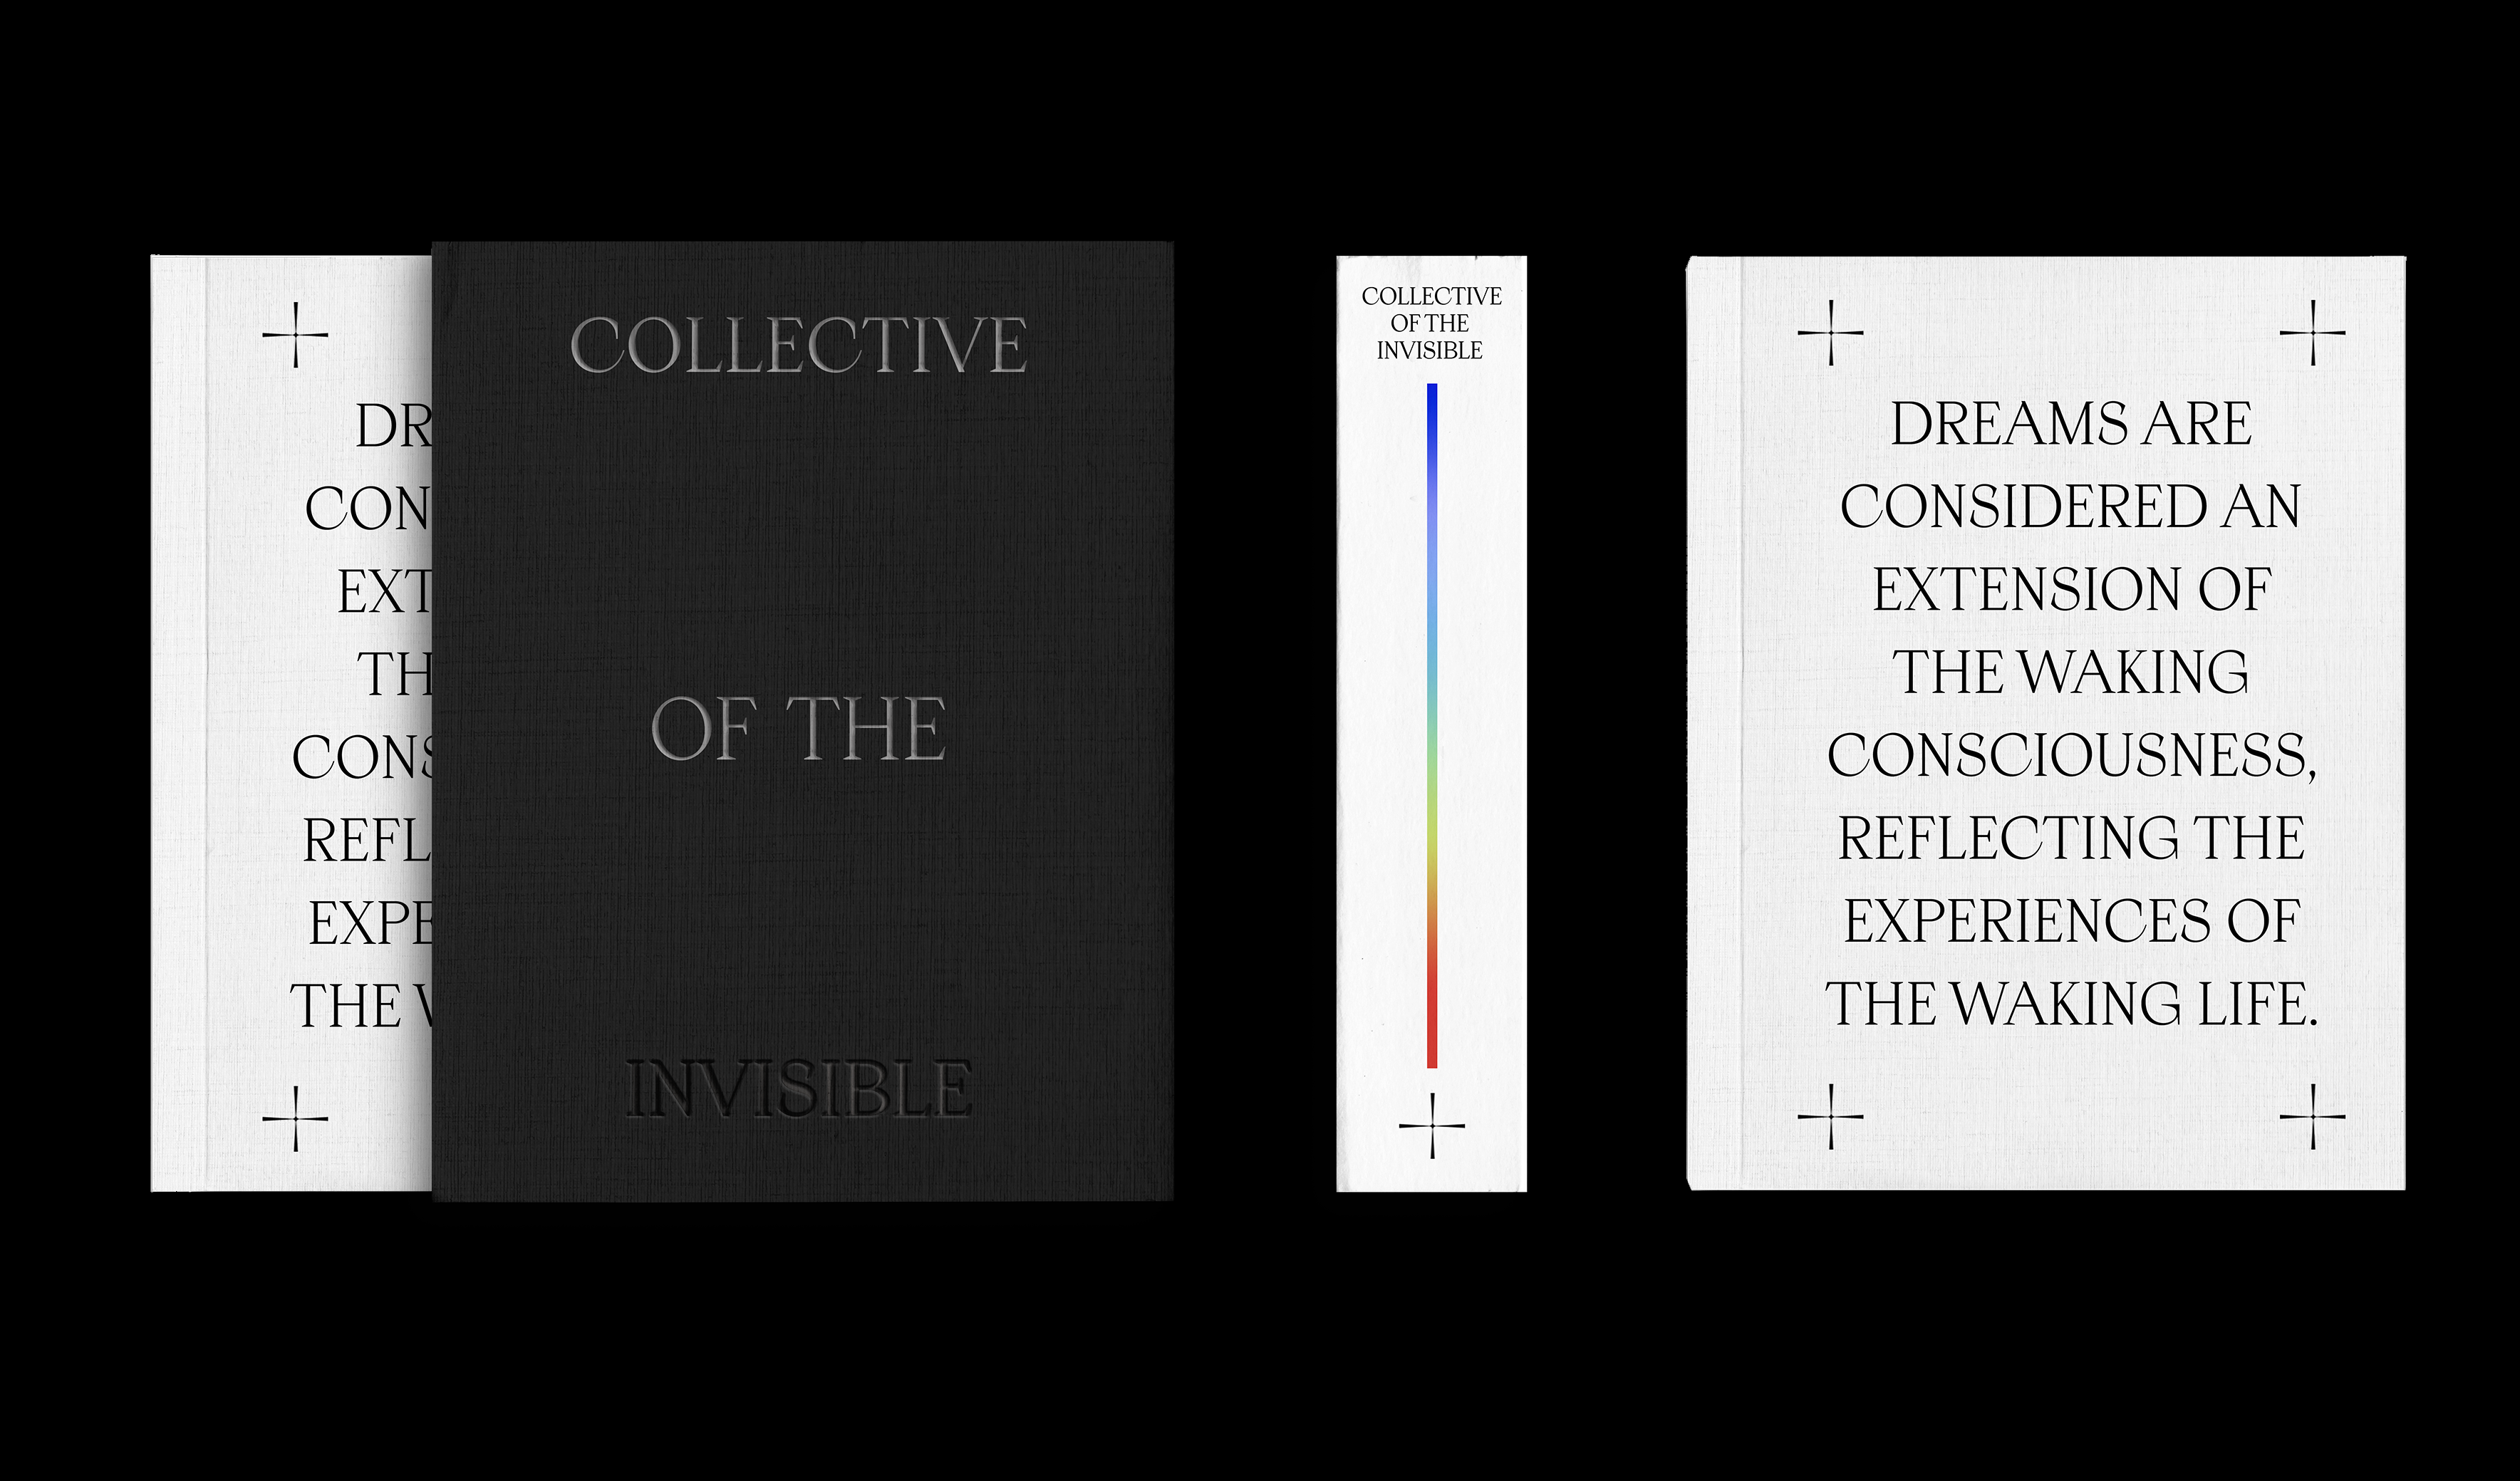
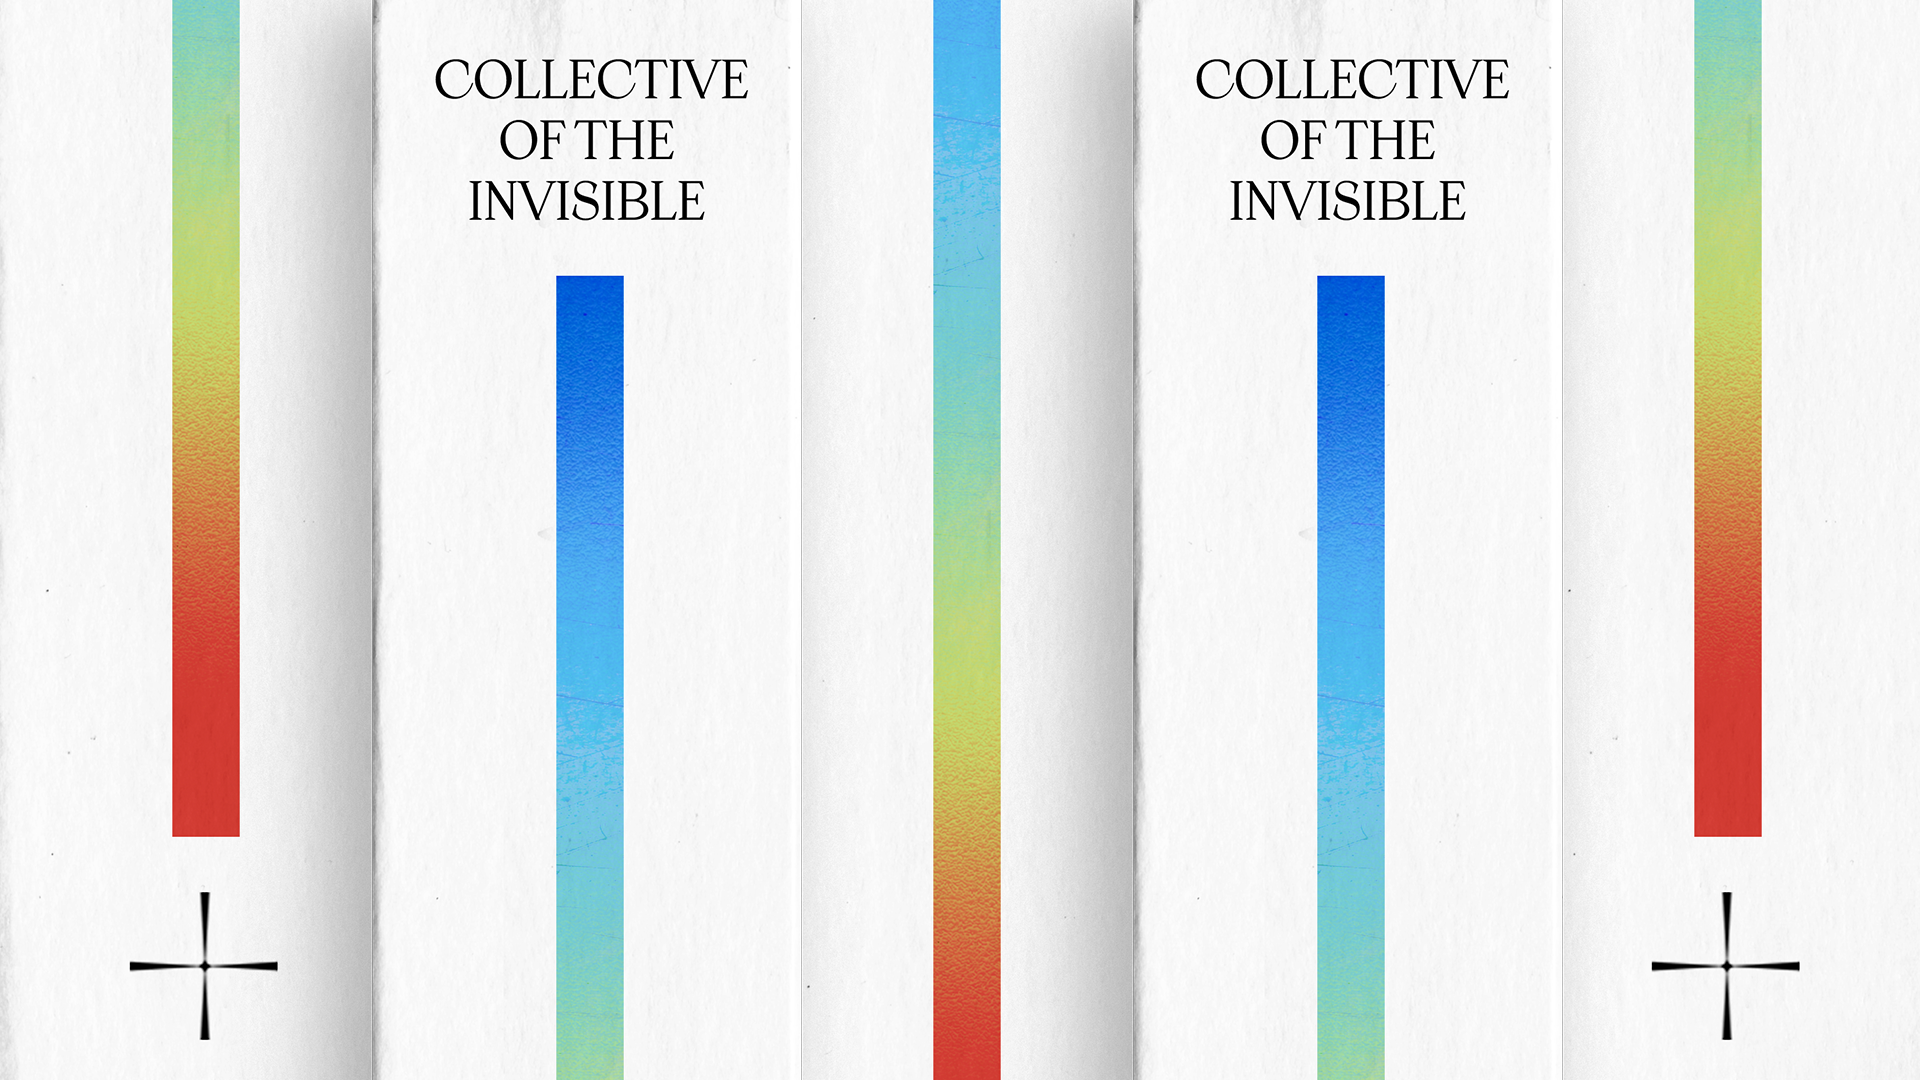
Collective of the Invisible is an exploration of dreaming as a new visual language through data collection and visualization. This thesis is a crowdsourcing project that collects our dreams and displays them in a web based data visualization format. Through coding and decoding dreams in the context of current events, the project creates a real-time snapshot of the unconscious mind.
This is a story told through data and assembled through generative design, looking at the ways we grieve, find solace, and move forward.
This is a story told through data and assembled through generative design, looking at the ways we grieve, find solace, and move forward.
Visual Development Concept
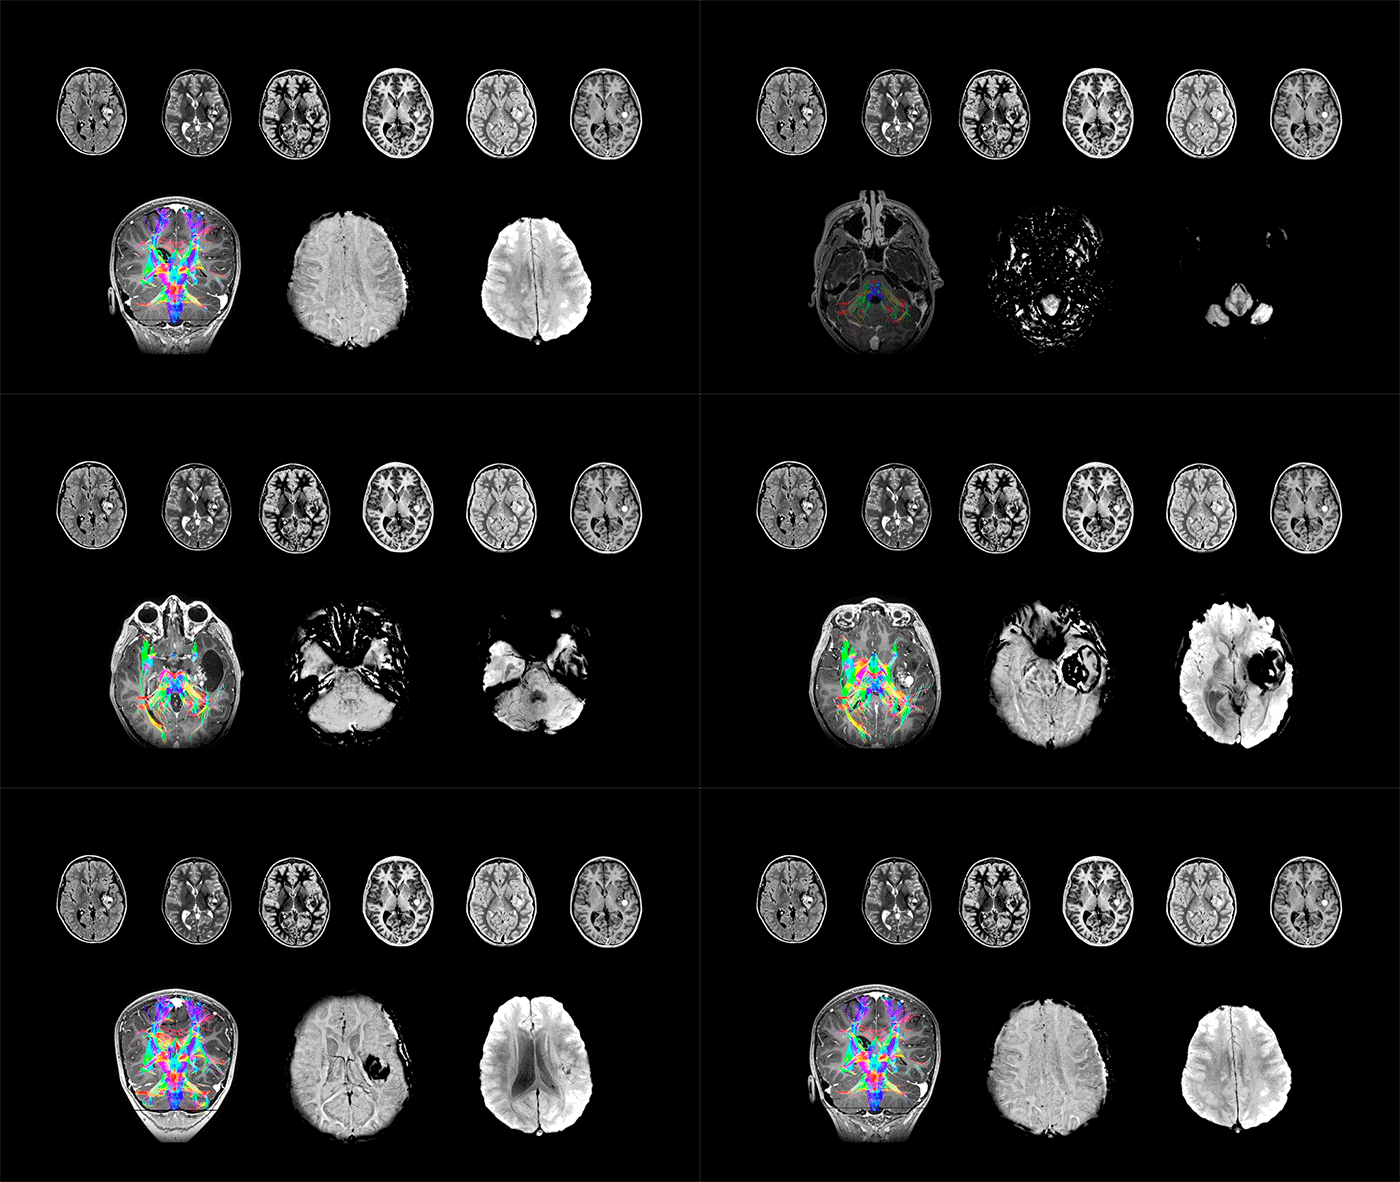
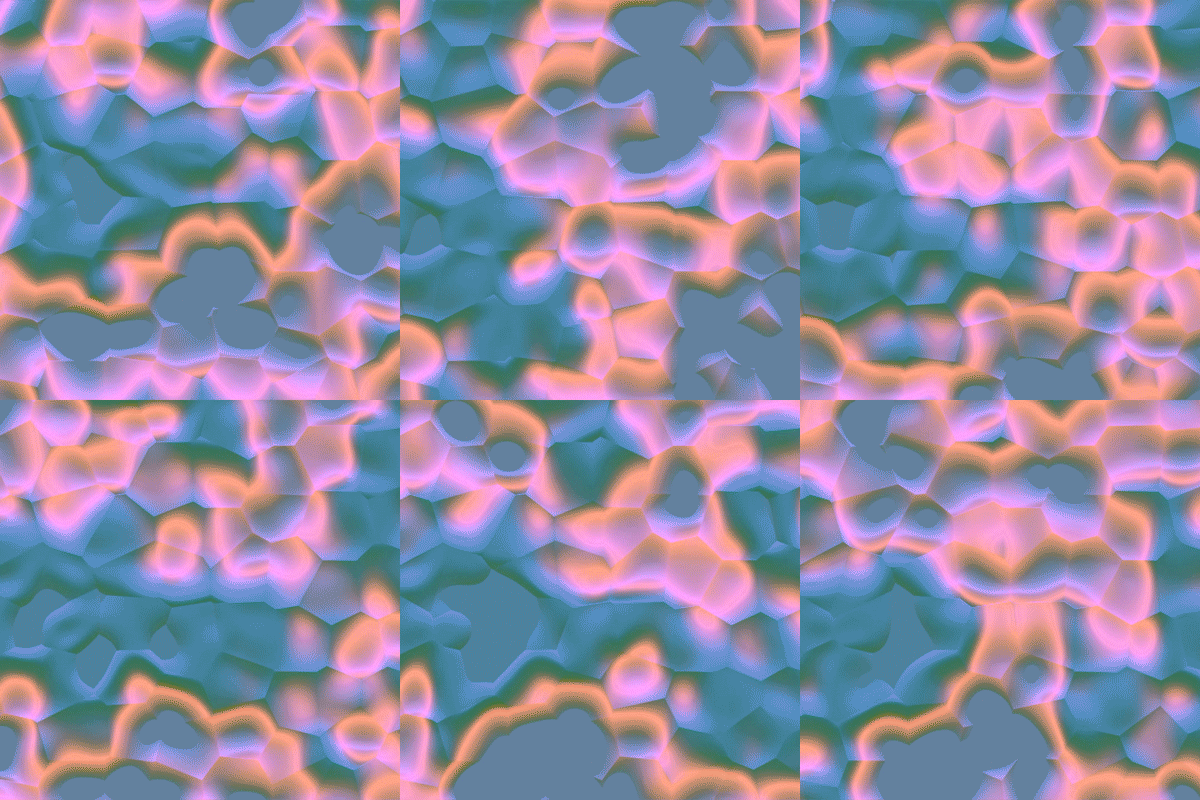
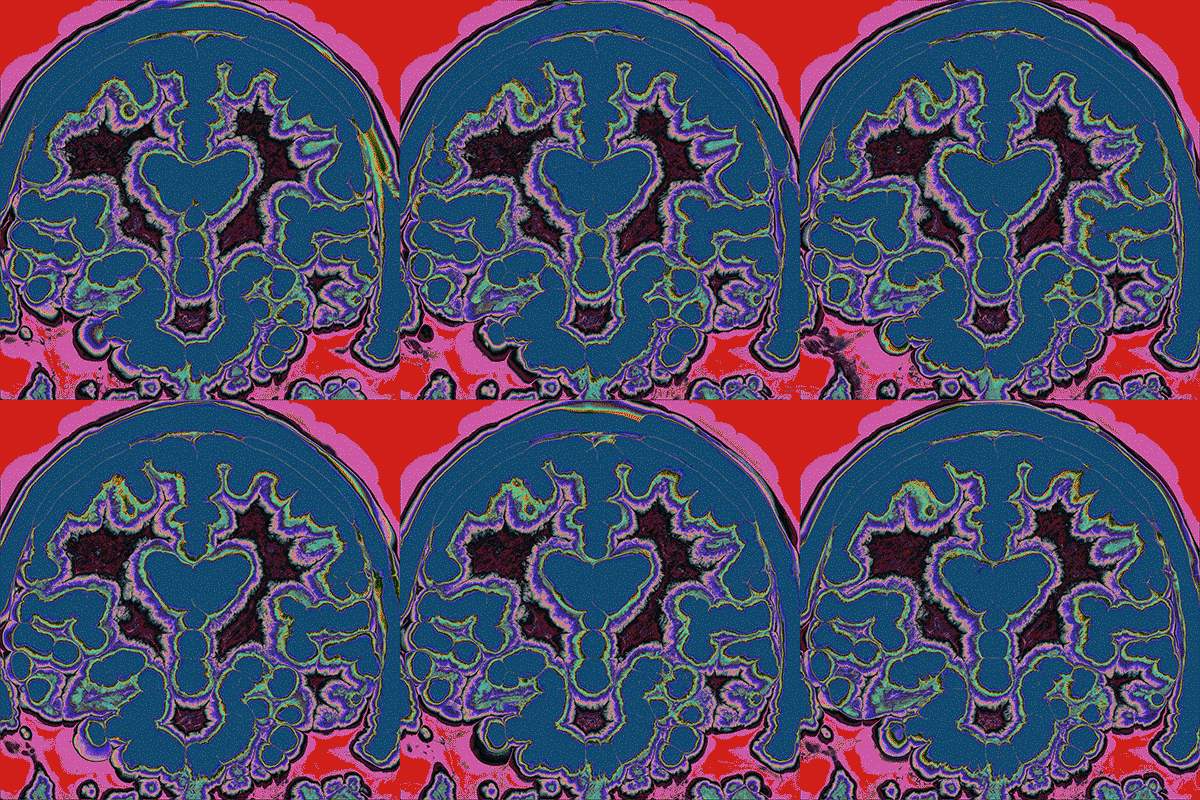
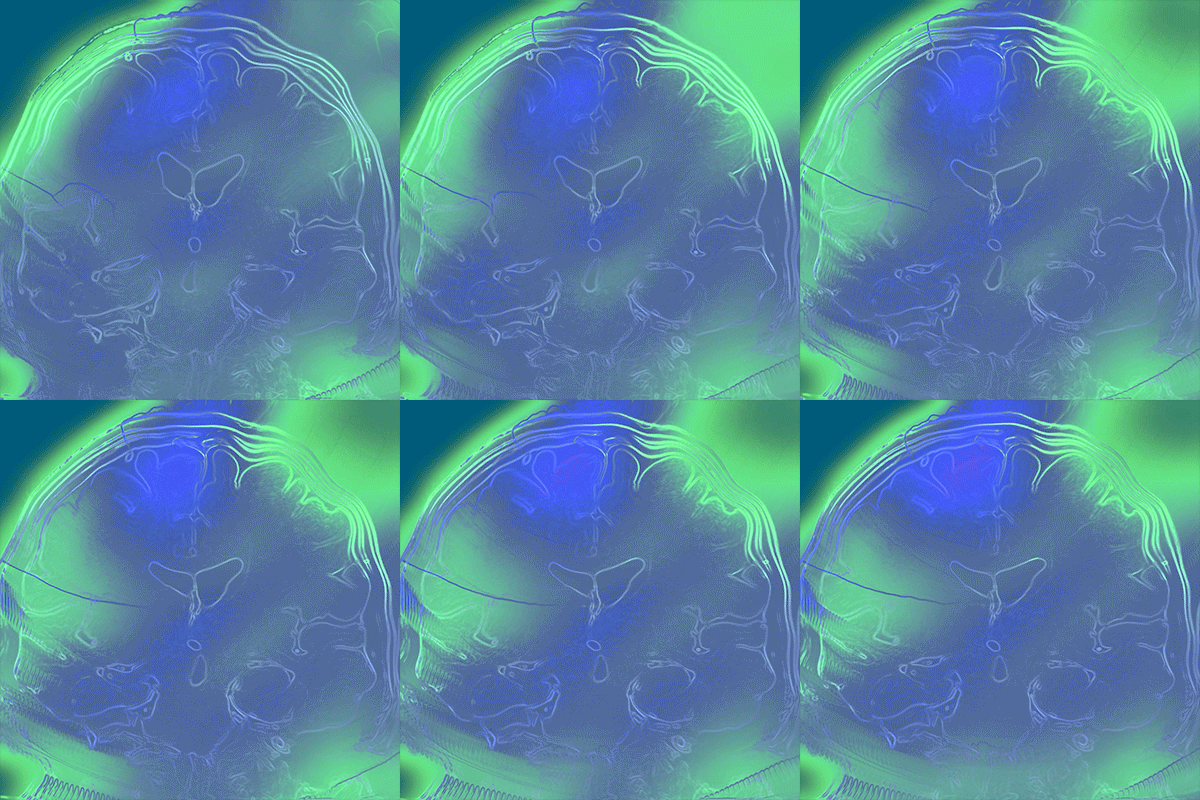
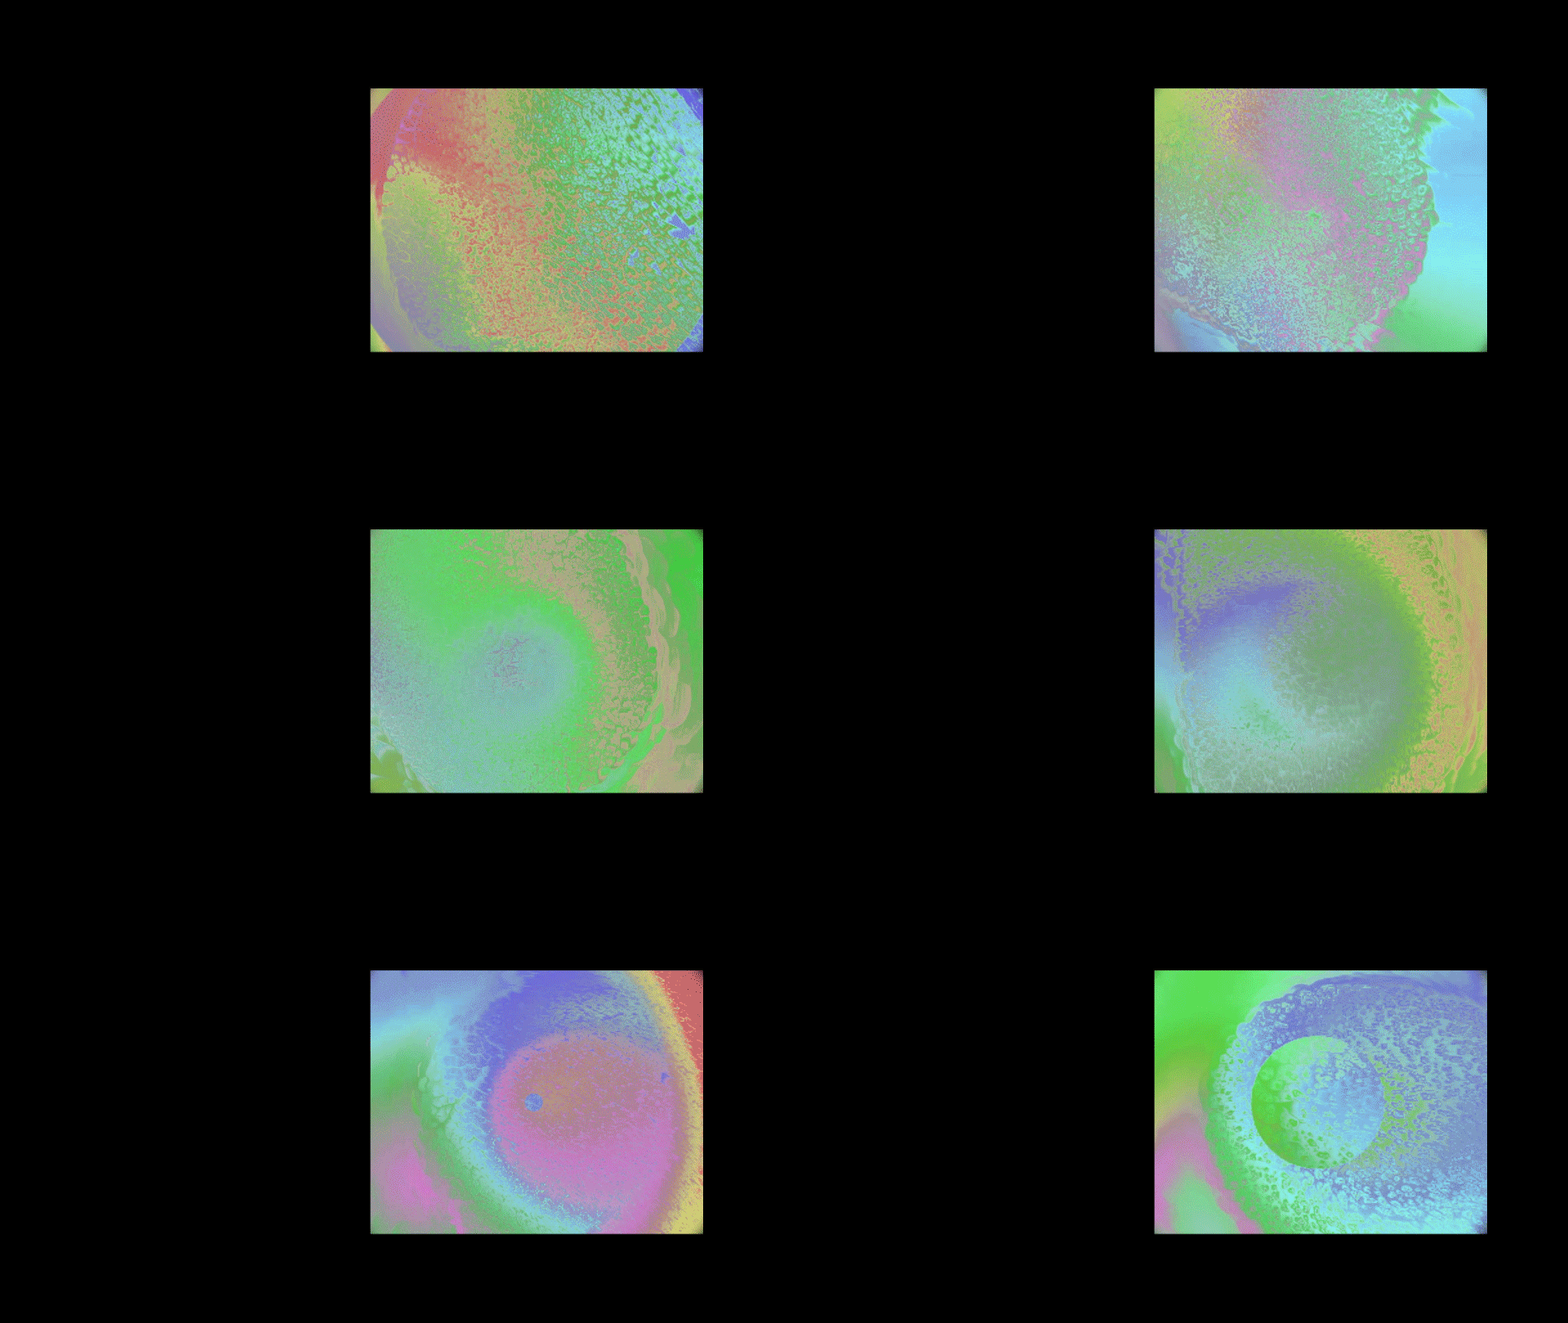
A recent research has shown that fluids in our brains light up when we are in deep sleep, and during this process of dreaming our brain fluids help carry out harmful build up of toxins. The main visuals were inspired by MRI-scans and movement of brain fluids.
TouchDesigner Visual Experiments
The TouchDesigner experiments are loose and fluid-like, which is what one would expect to see on an MRI-scan during deep sleep.
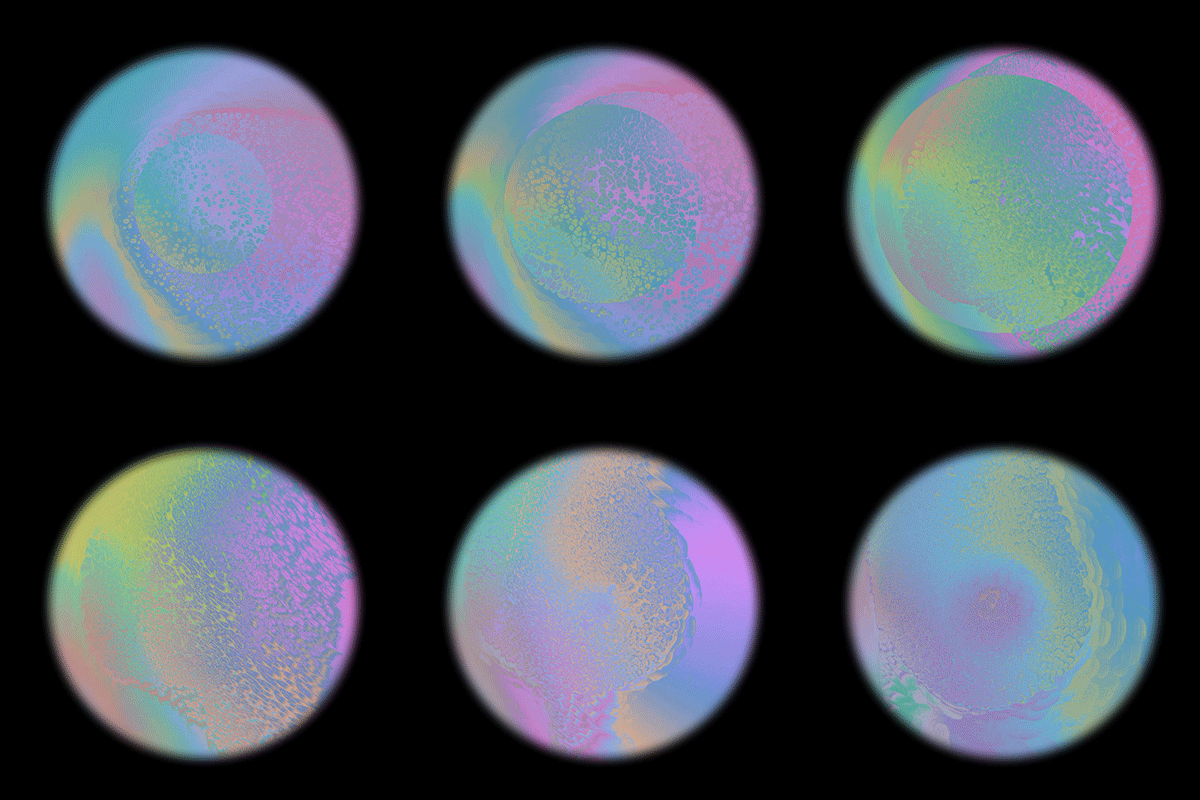
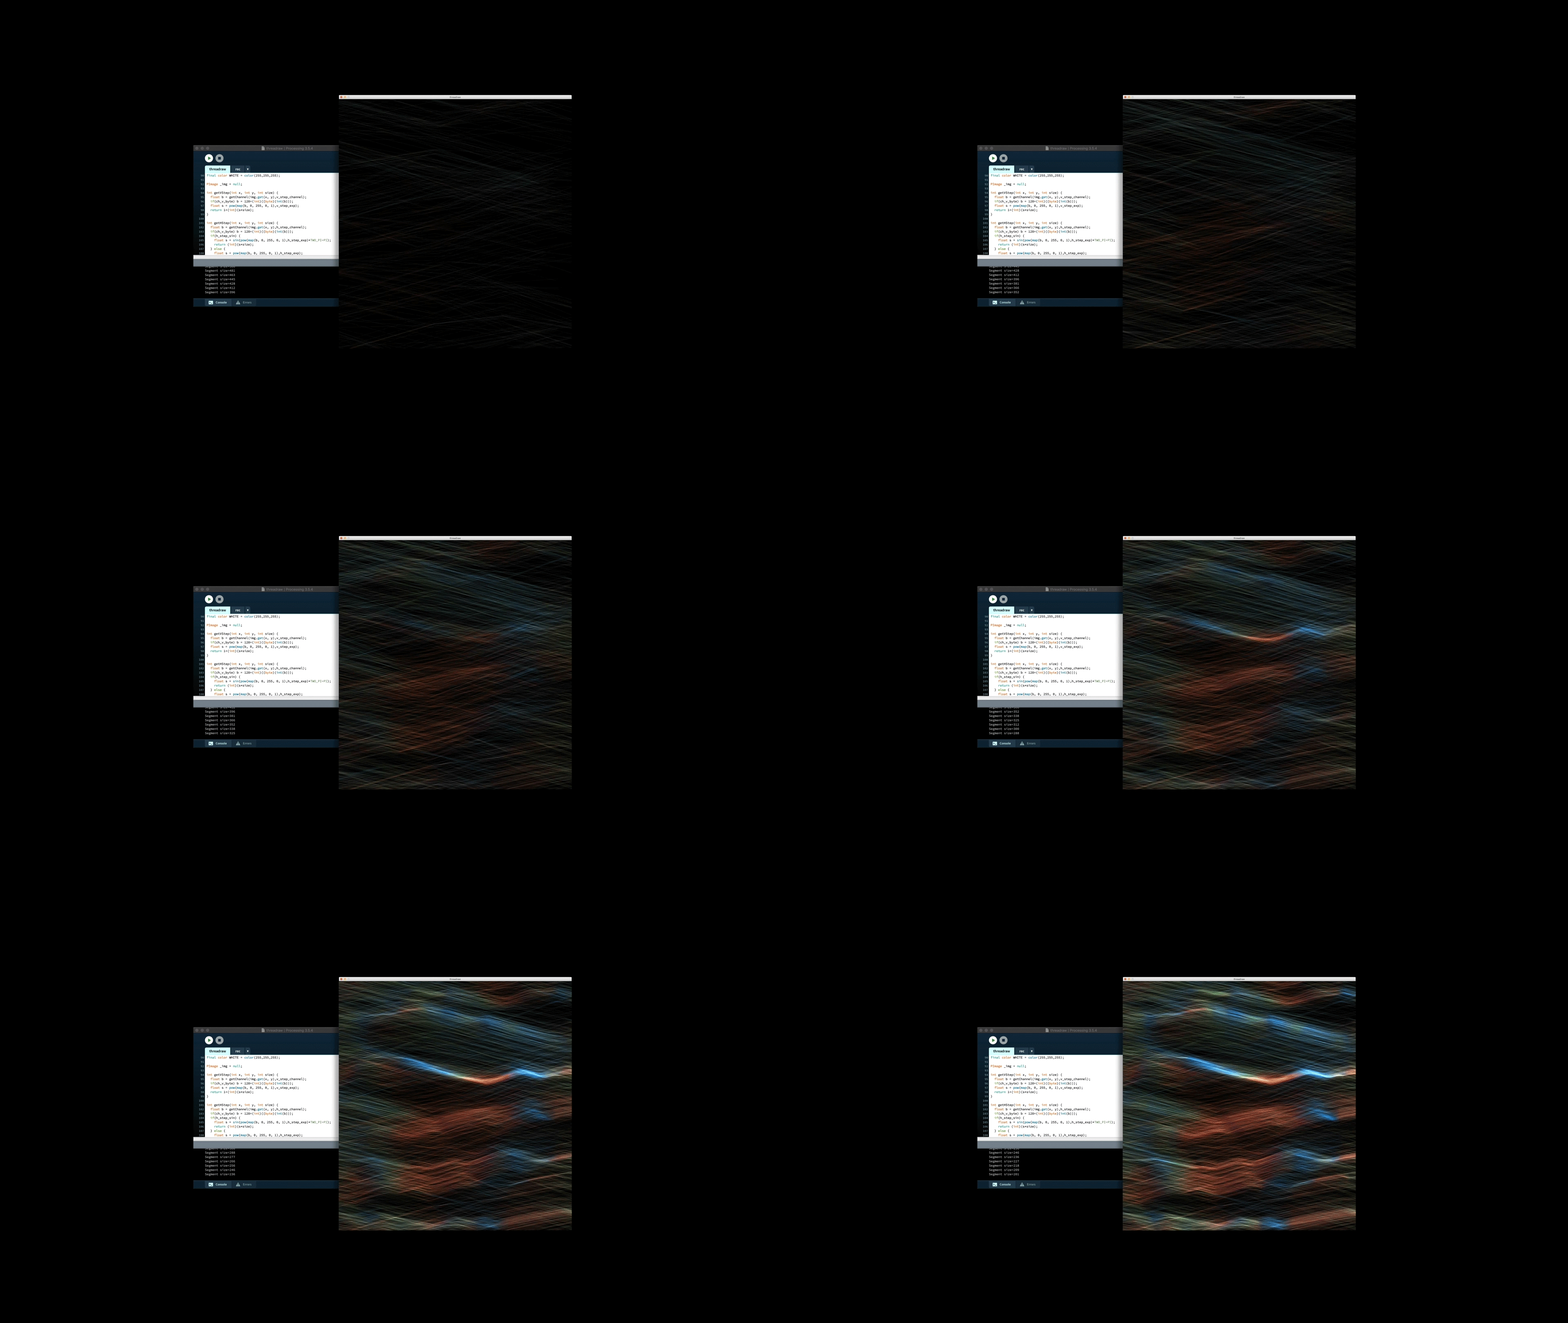
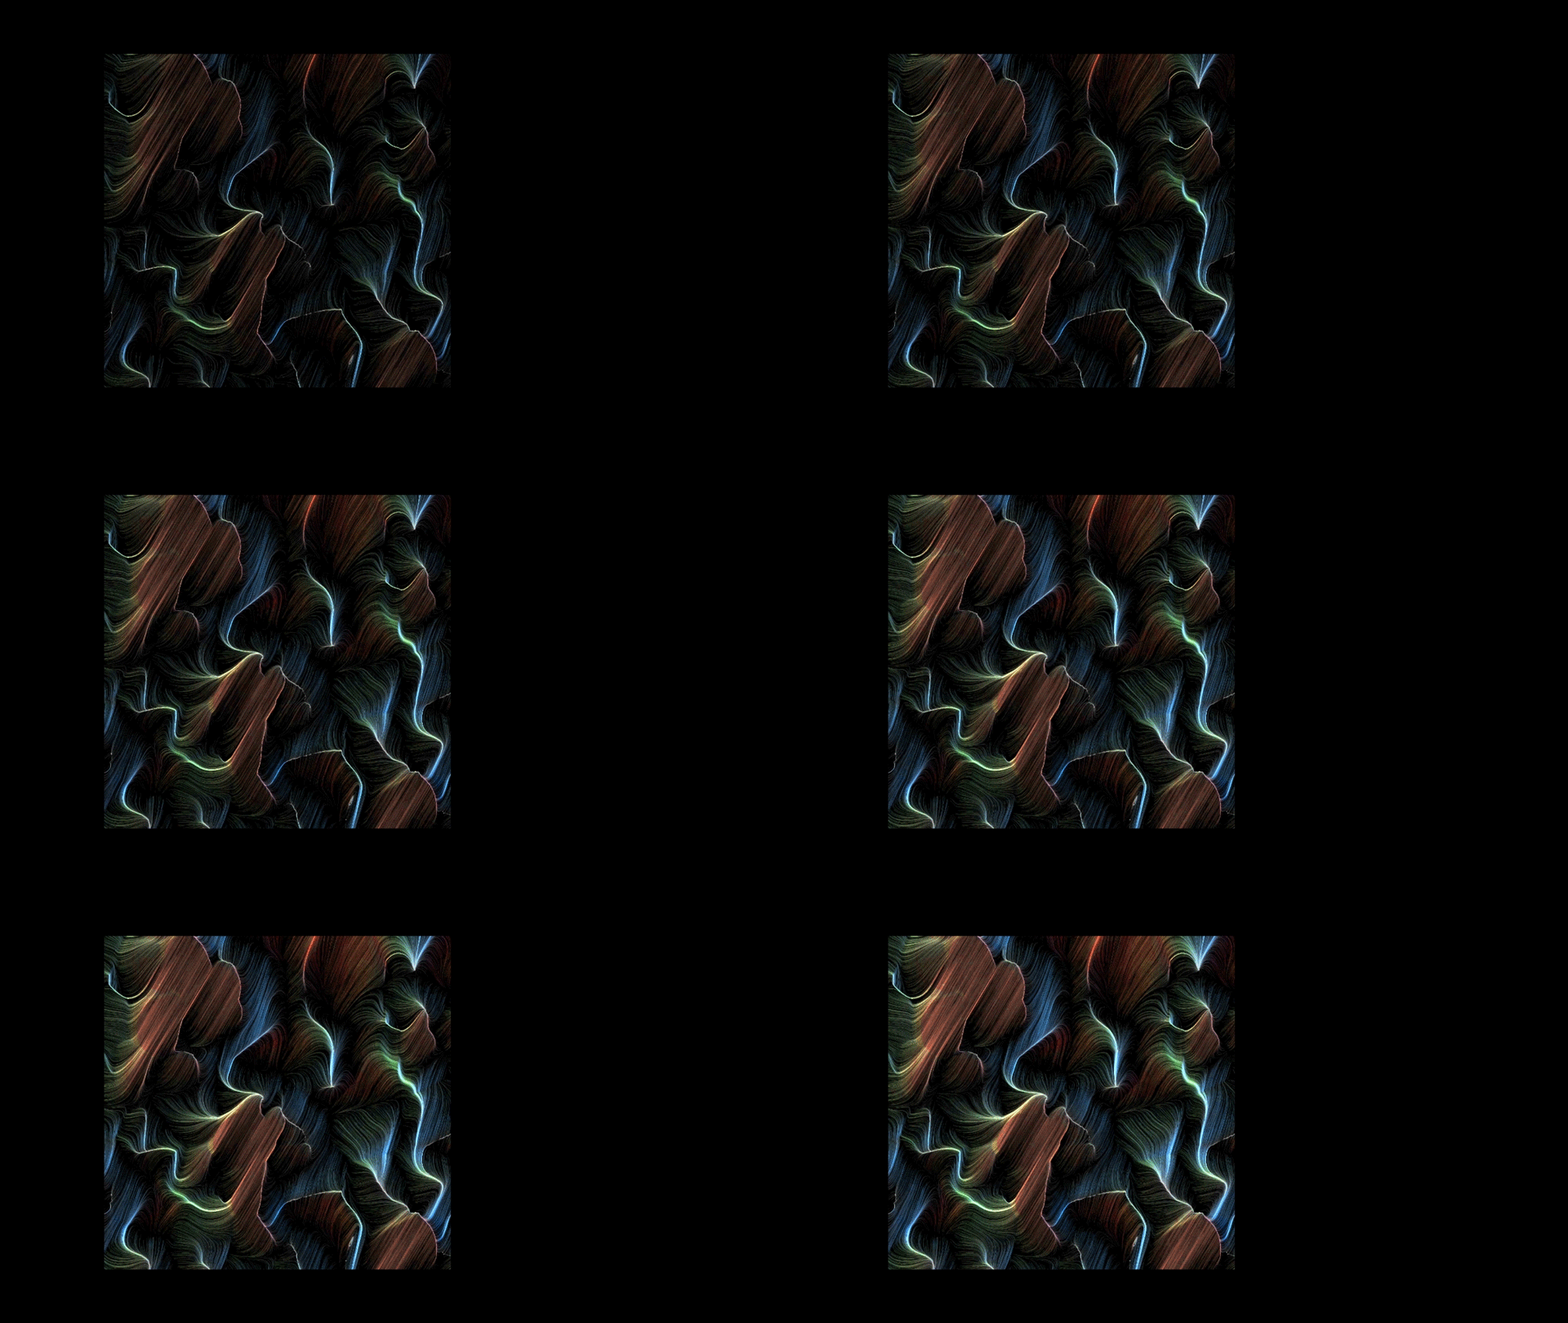
Generating Threads
The second visual identity that was created for the thesis is the idea of threads. I was really inspired by the quote: “We, in remembering and dreaming, make a web for all individuals to gain.” I used the GenerateMe library on Processing to generate images with millions of tiny threads that were drawn over each other. This process of drawing threads speaks to how I’m layering different data upon each other for the final data visualization.
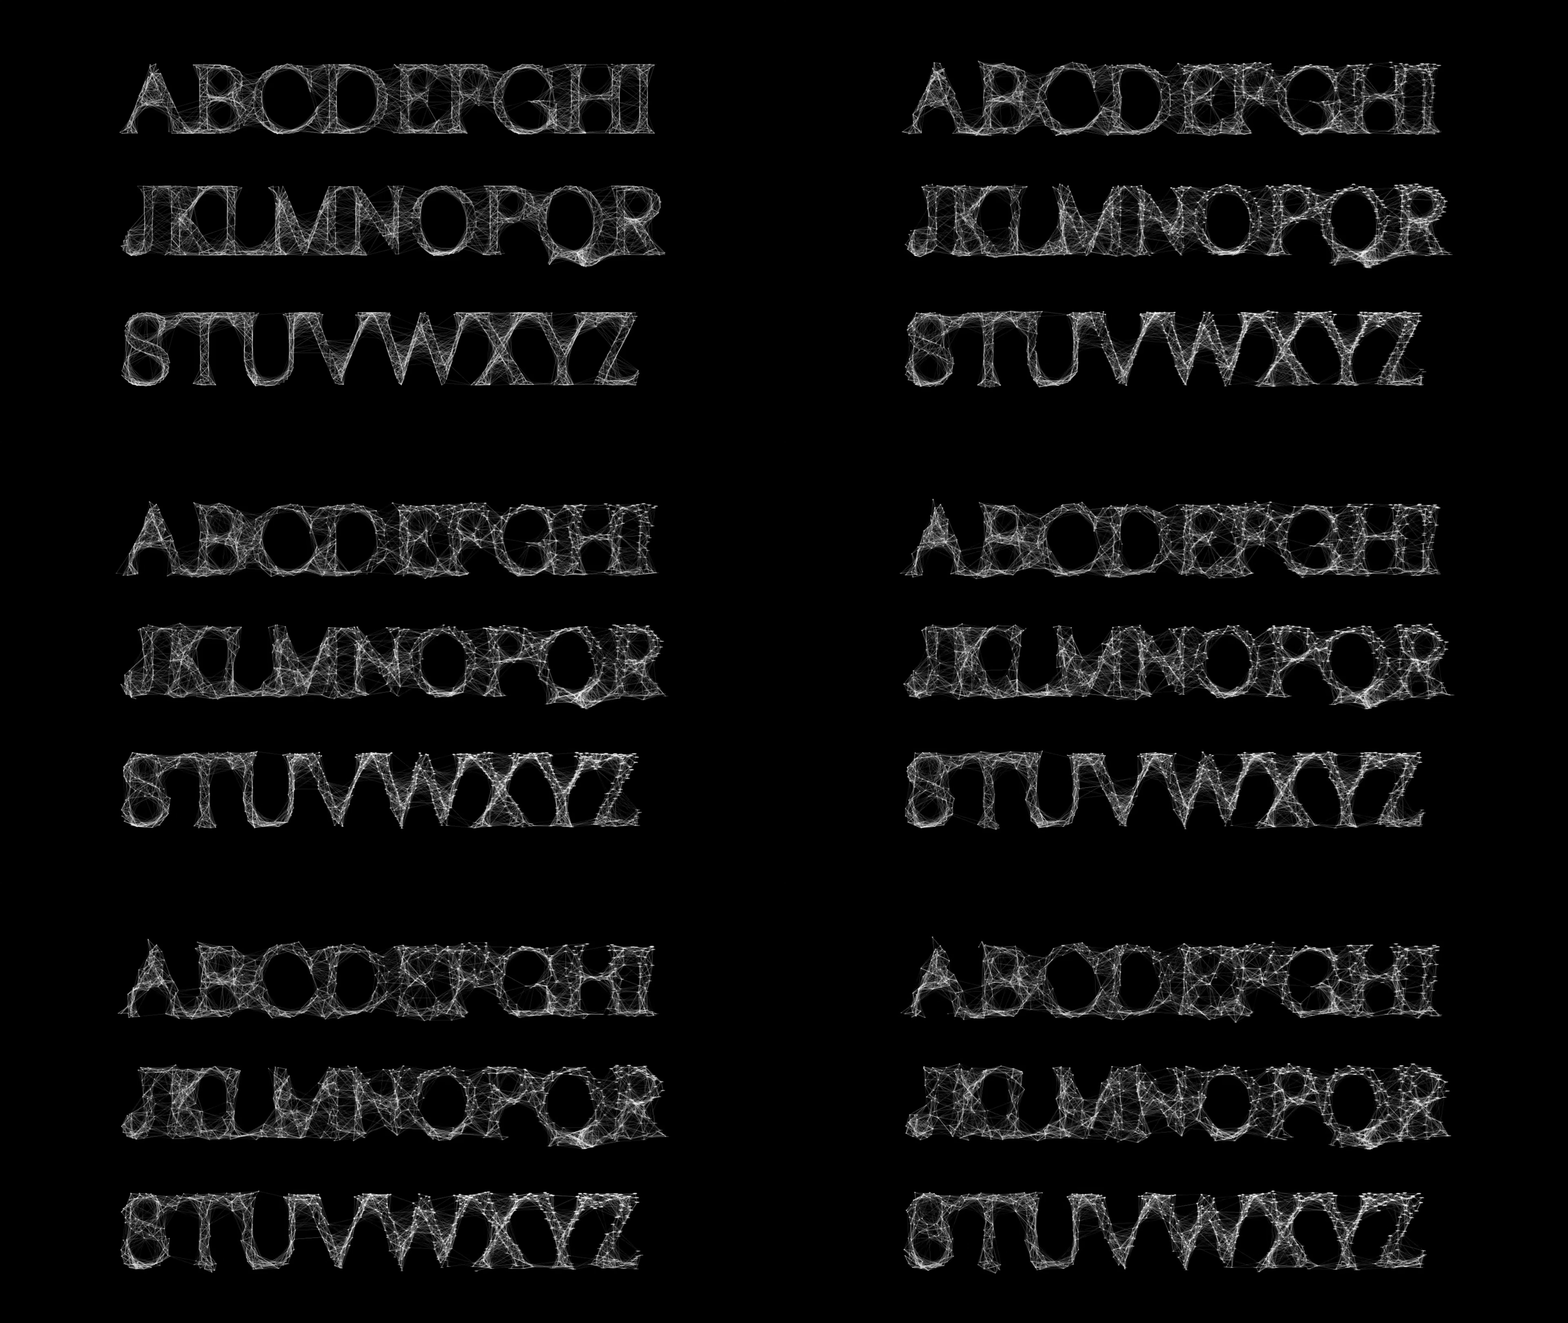
Custom Typeface
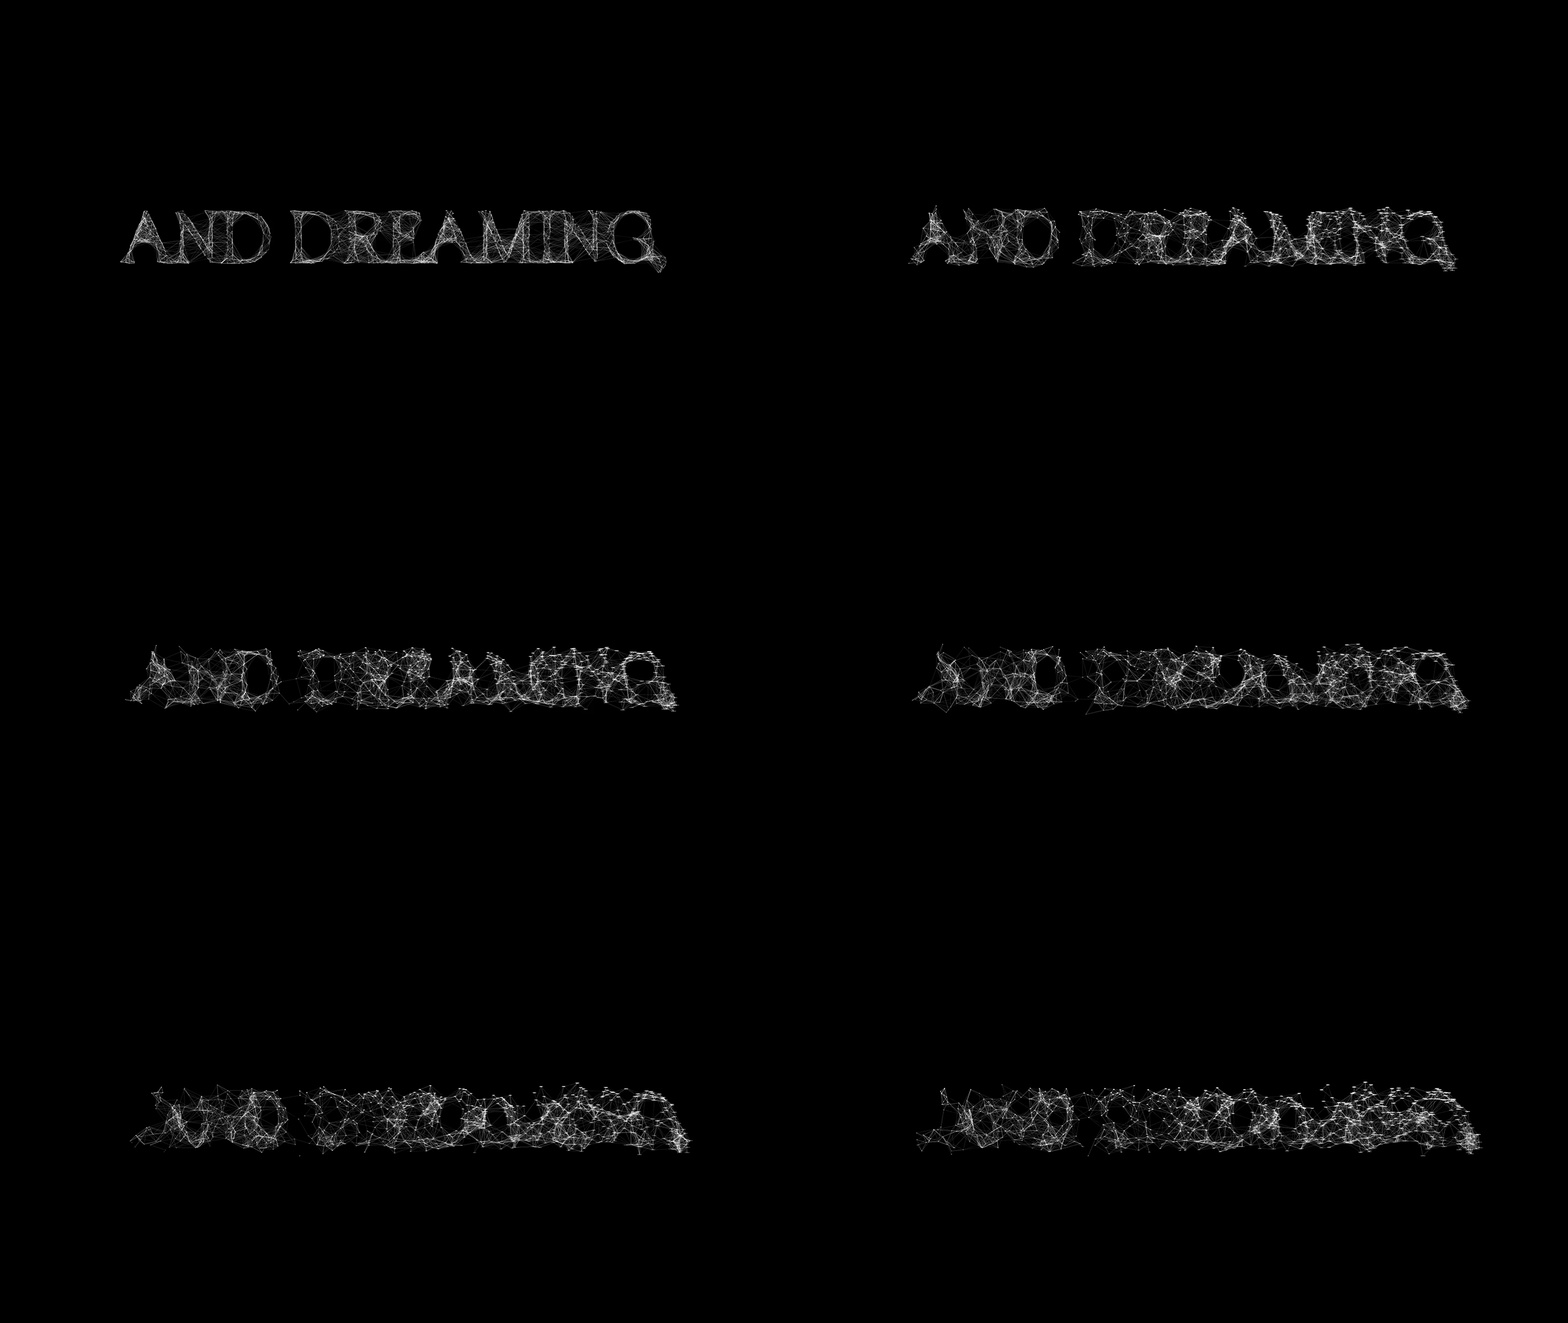
Connected lines and dots to form a typeface that echoes the idea of how the brain can generate new ideas and form connections in a way that the waking mind never does.

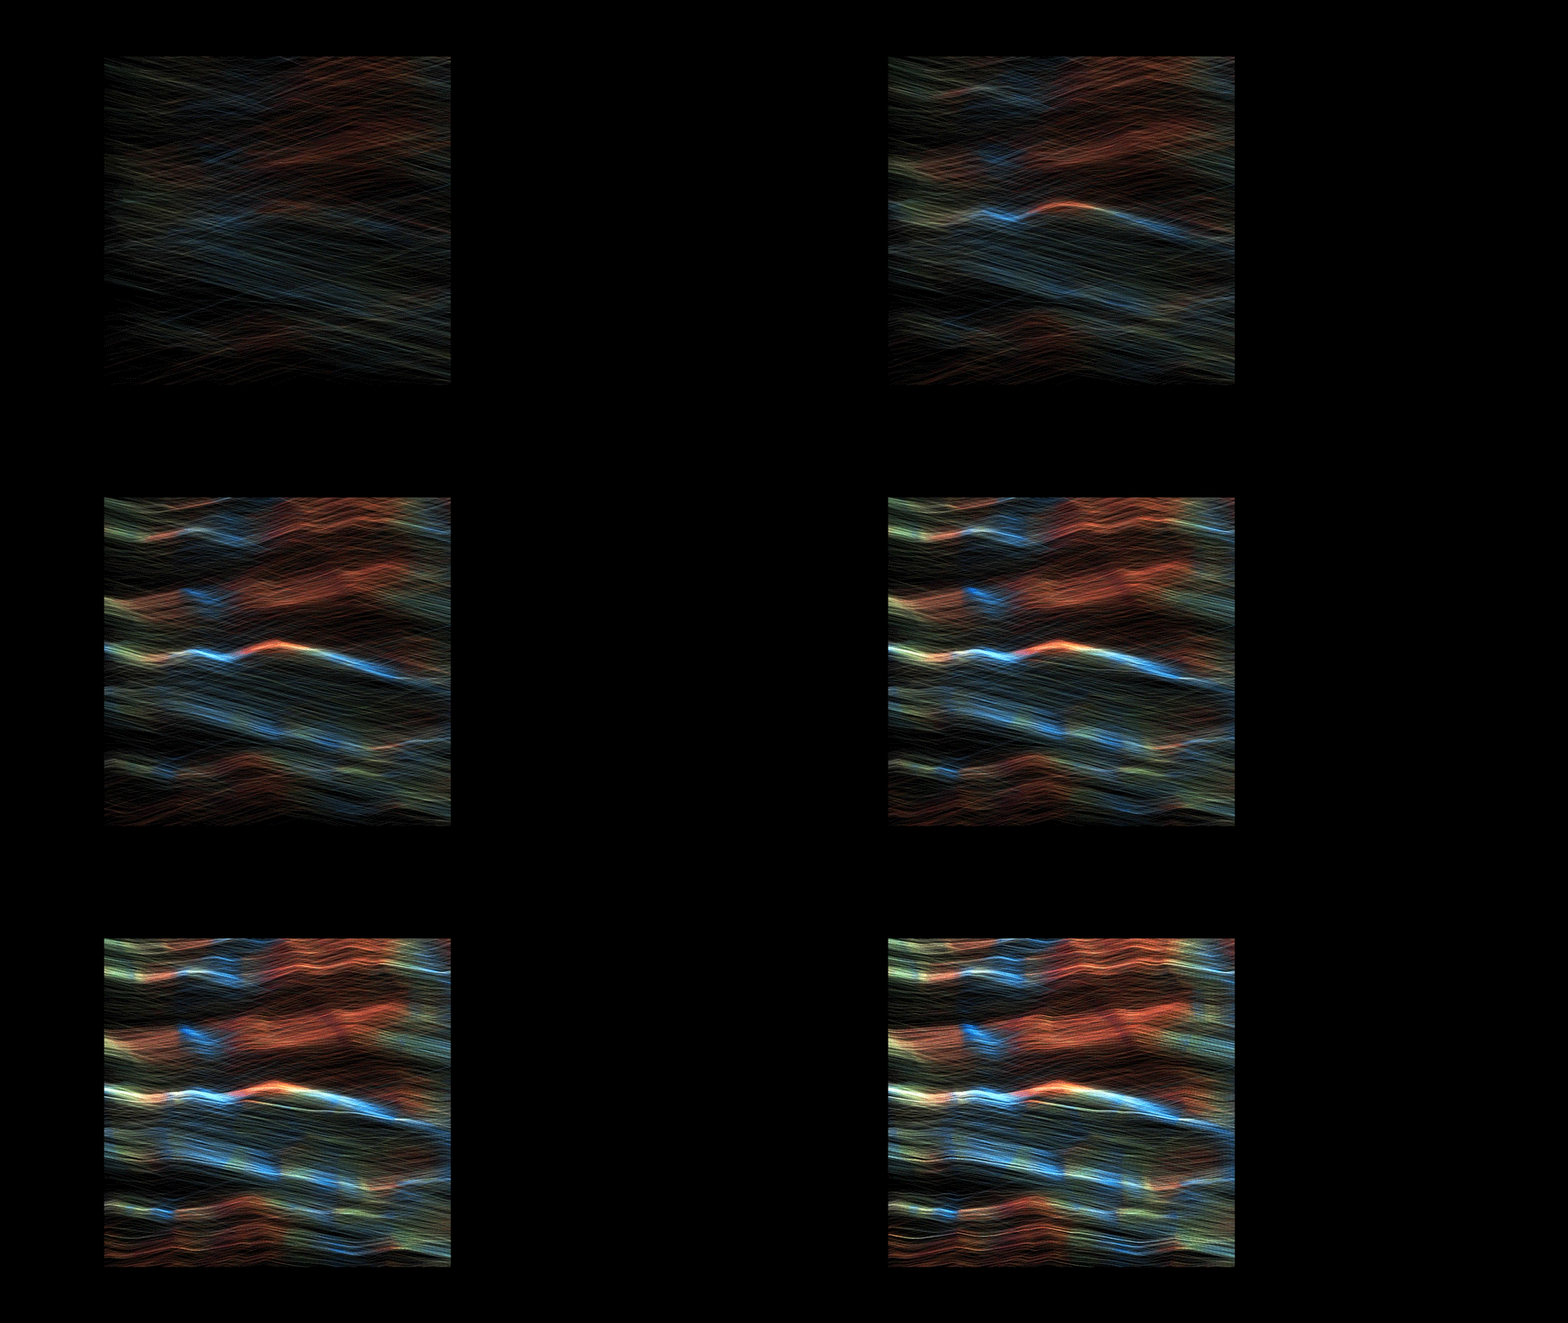
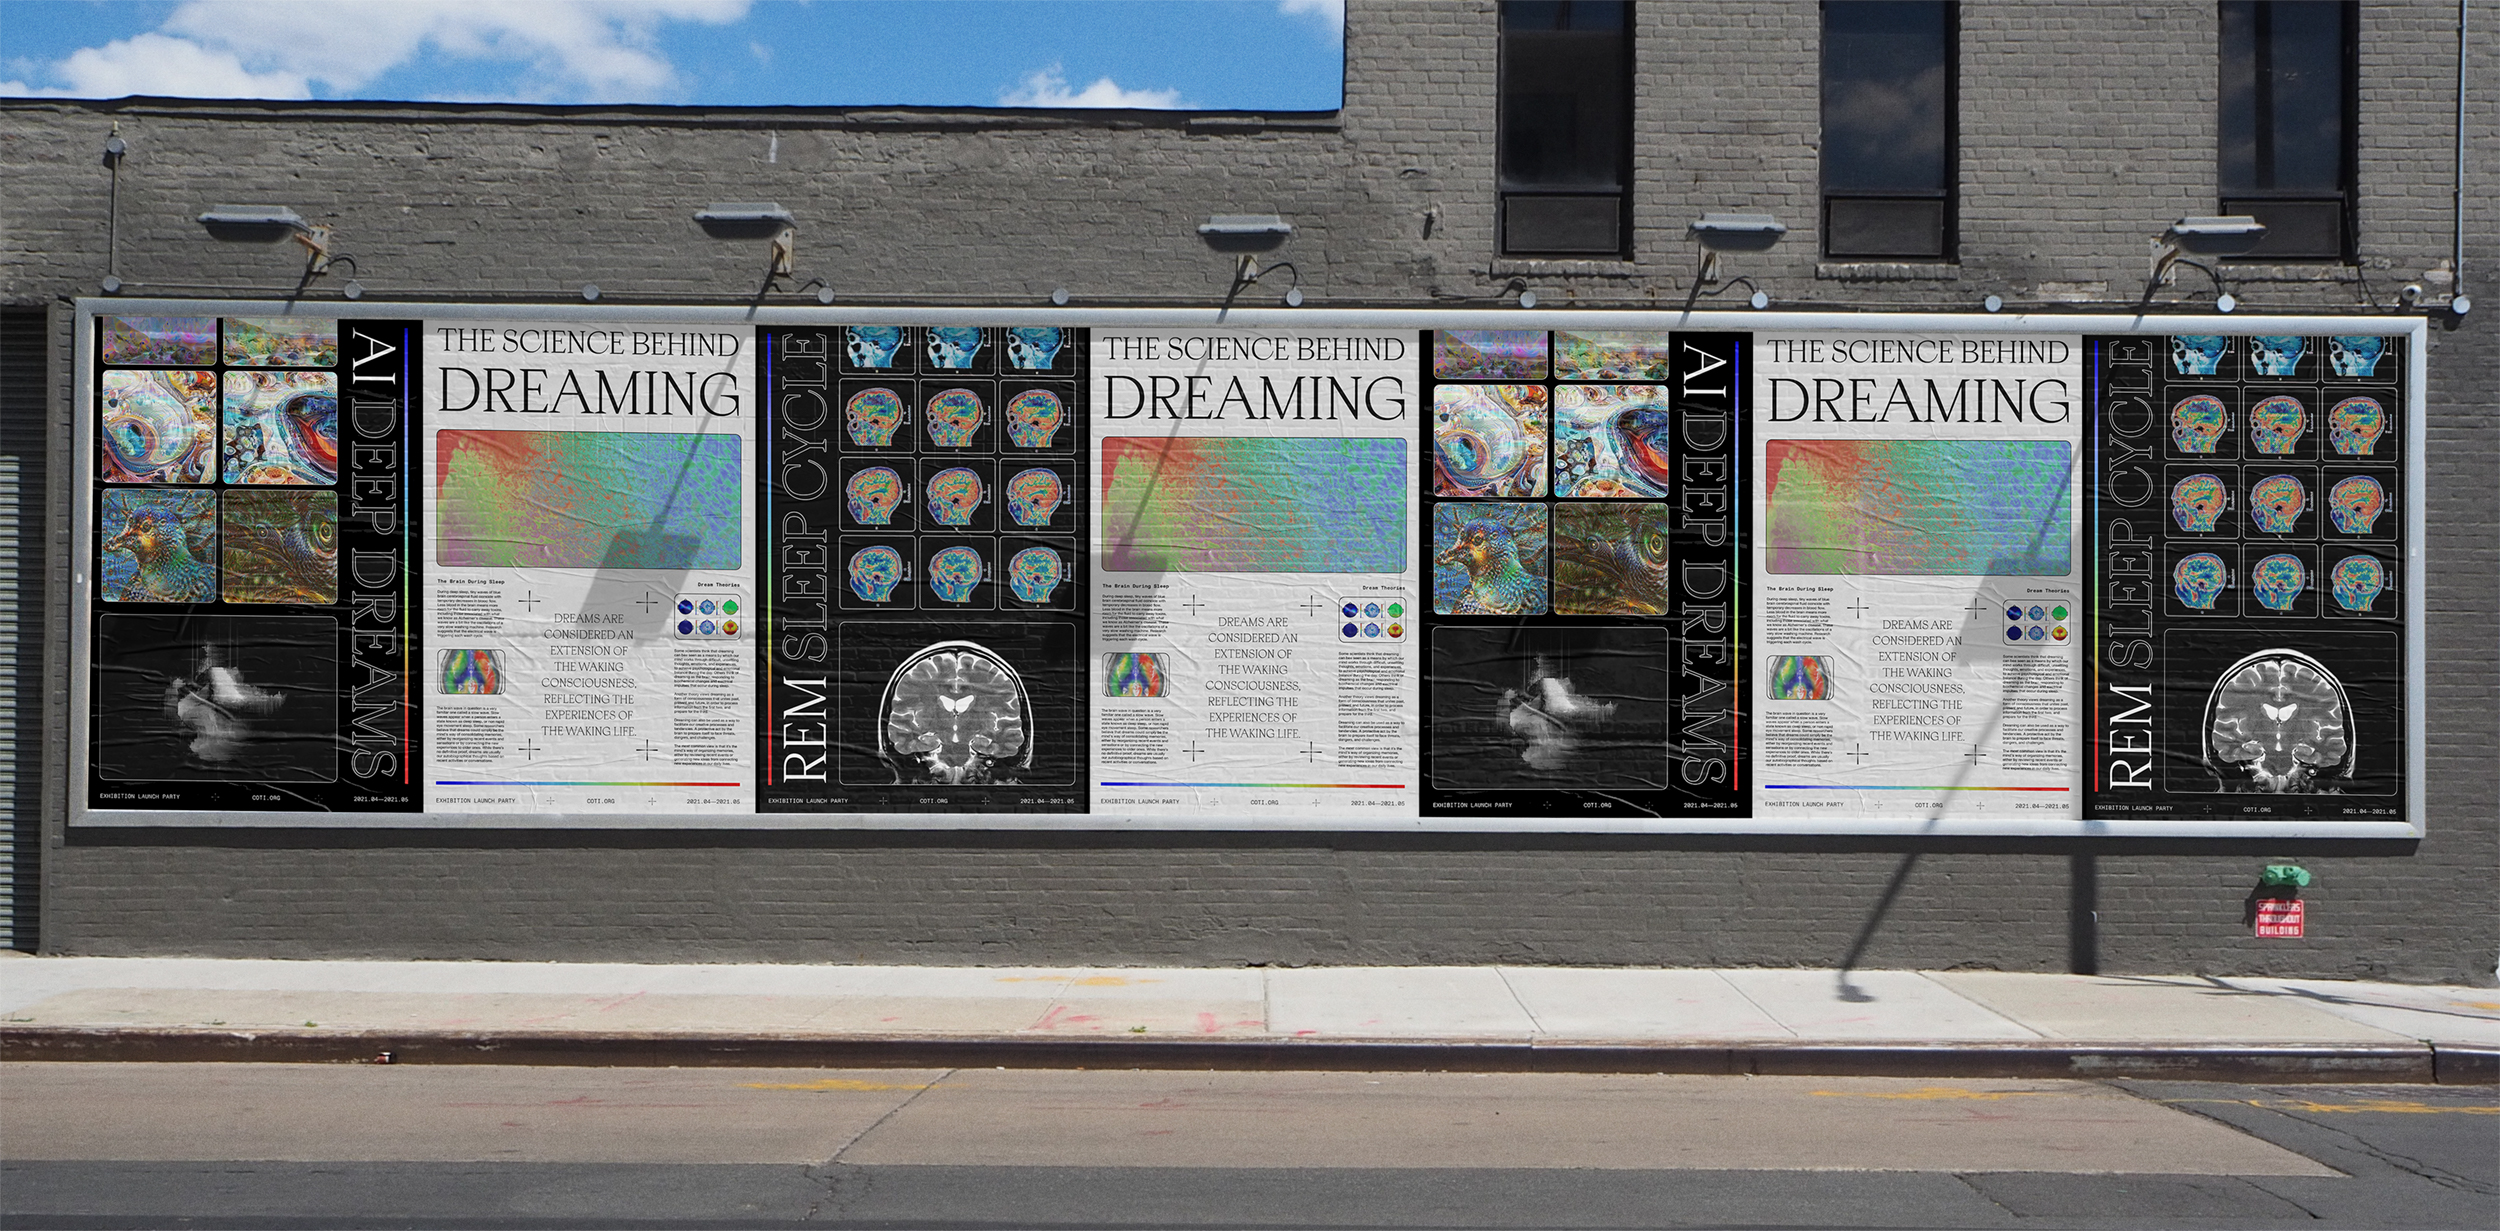
Poster Series
I created a series of posters to illustrate how the threads build and layer upon each other to create this collective web of dreaming. The custom typeface starts out as separate nodes, which then slowly forms a web in the end.


Method
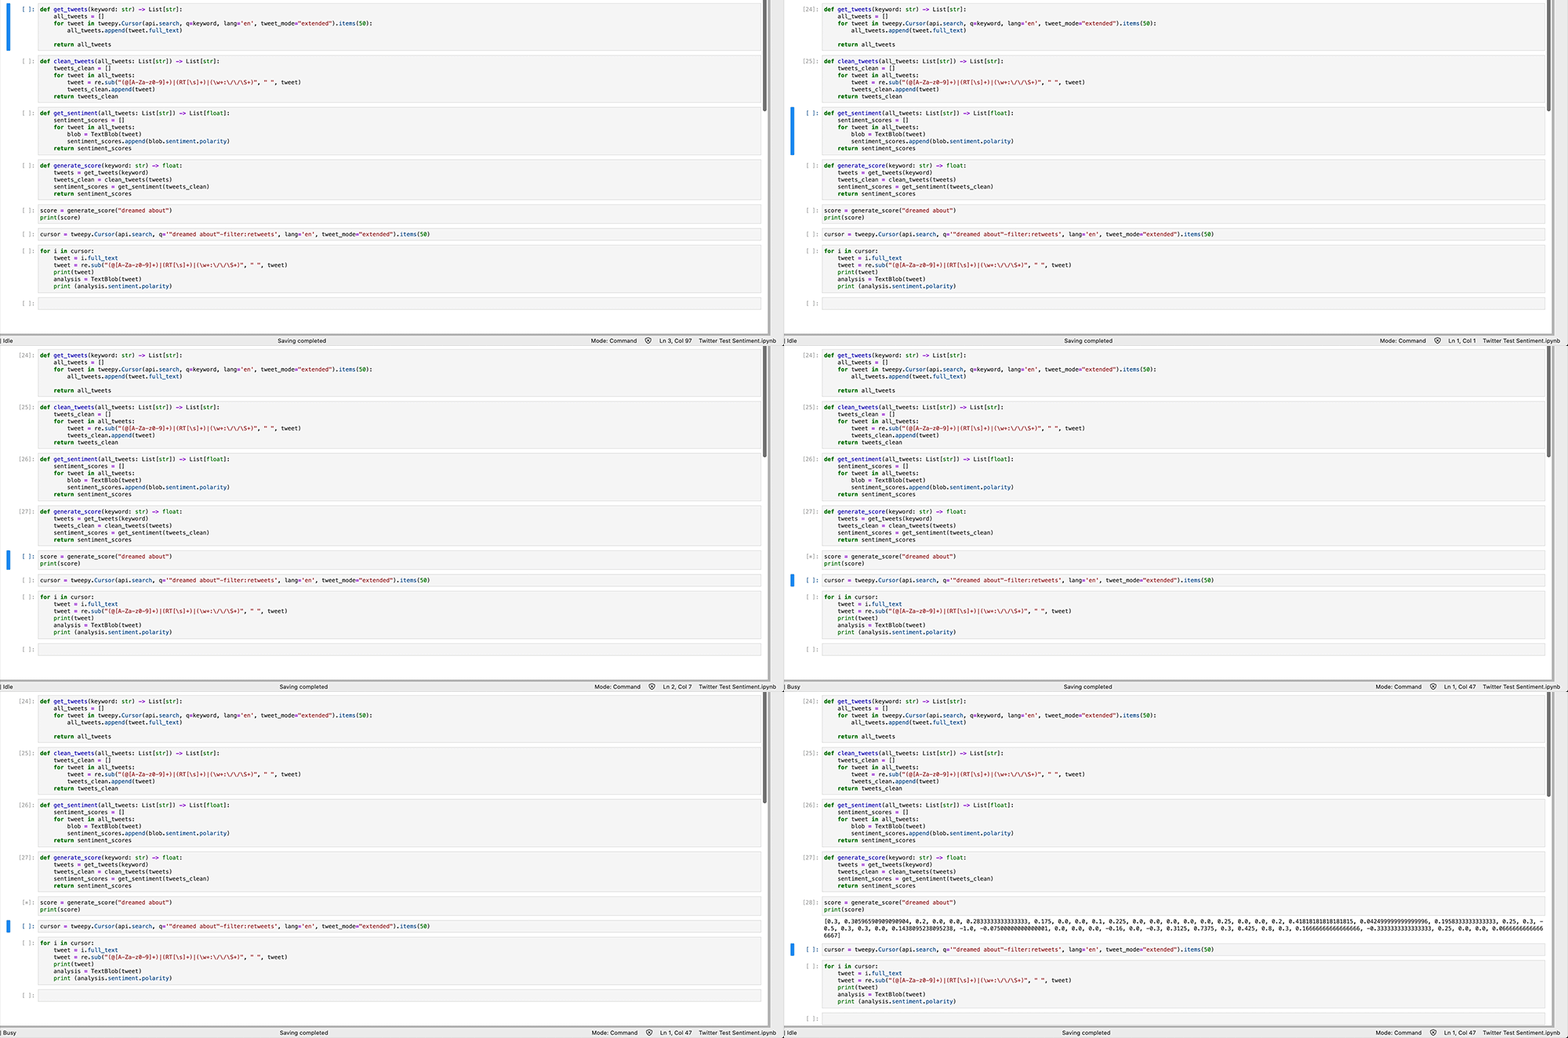
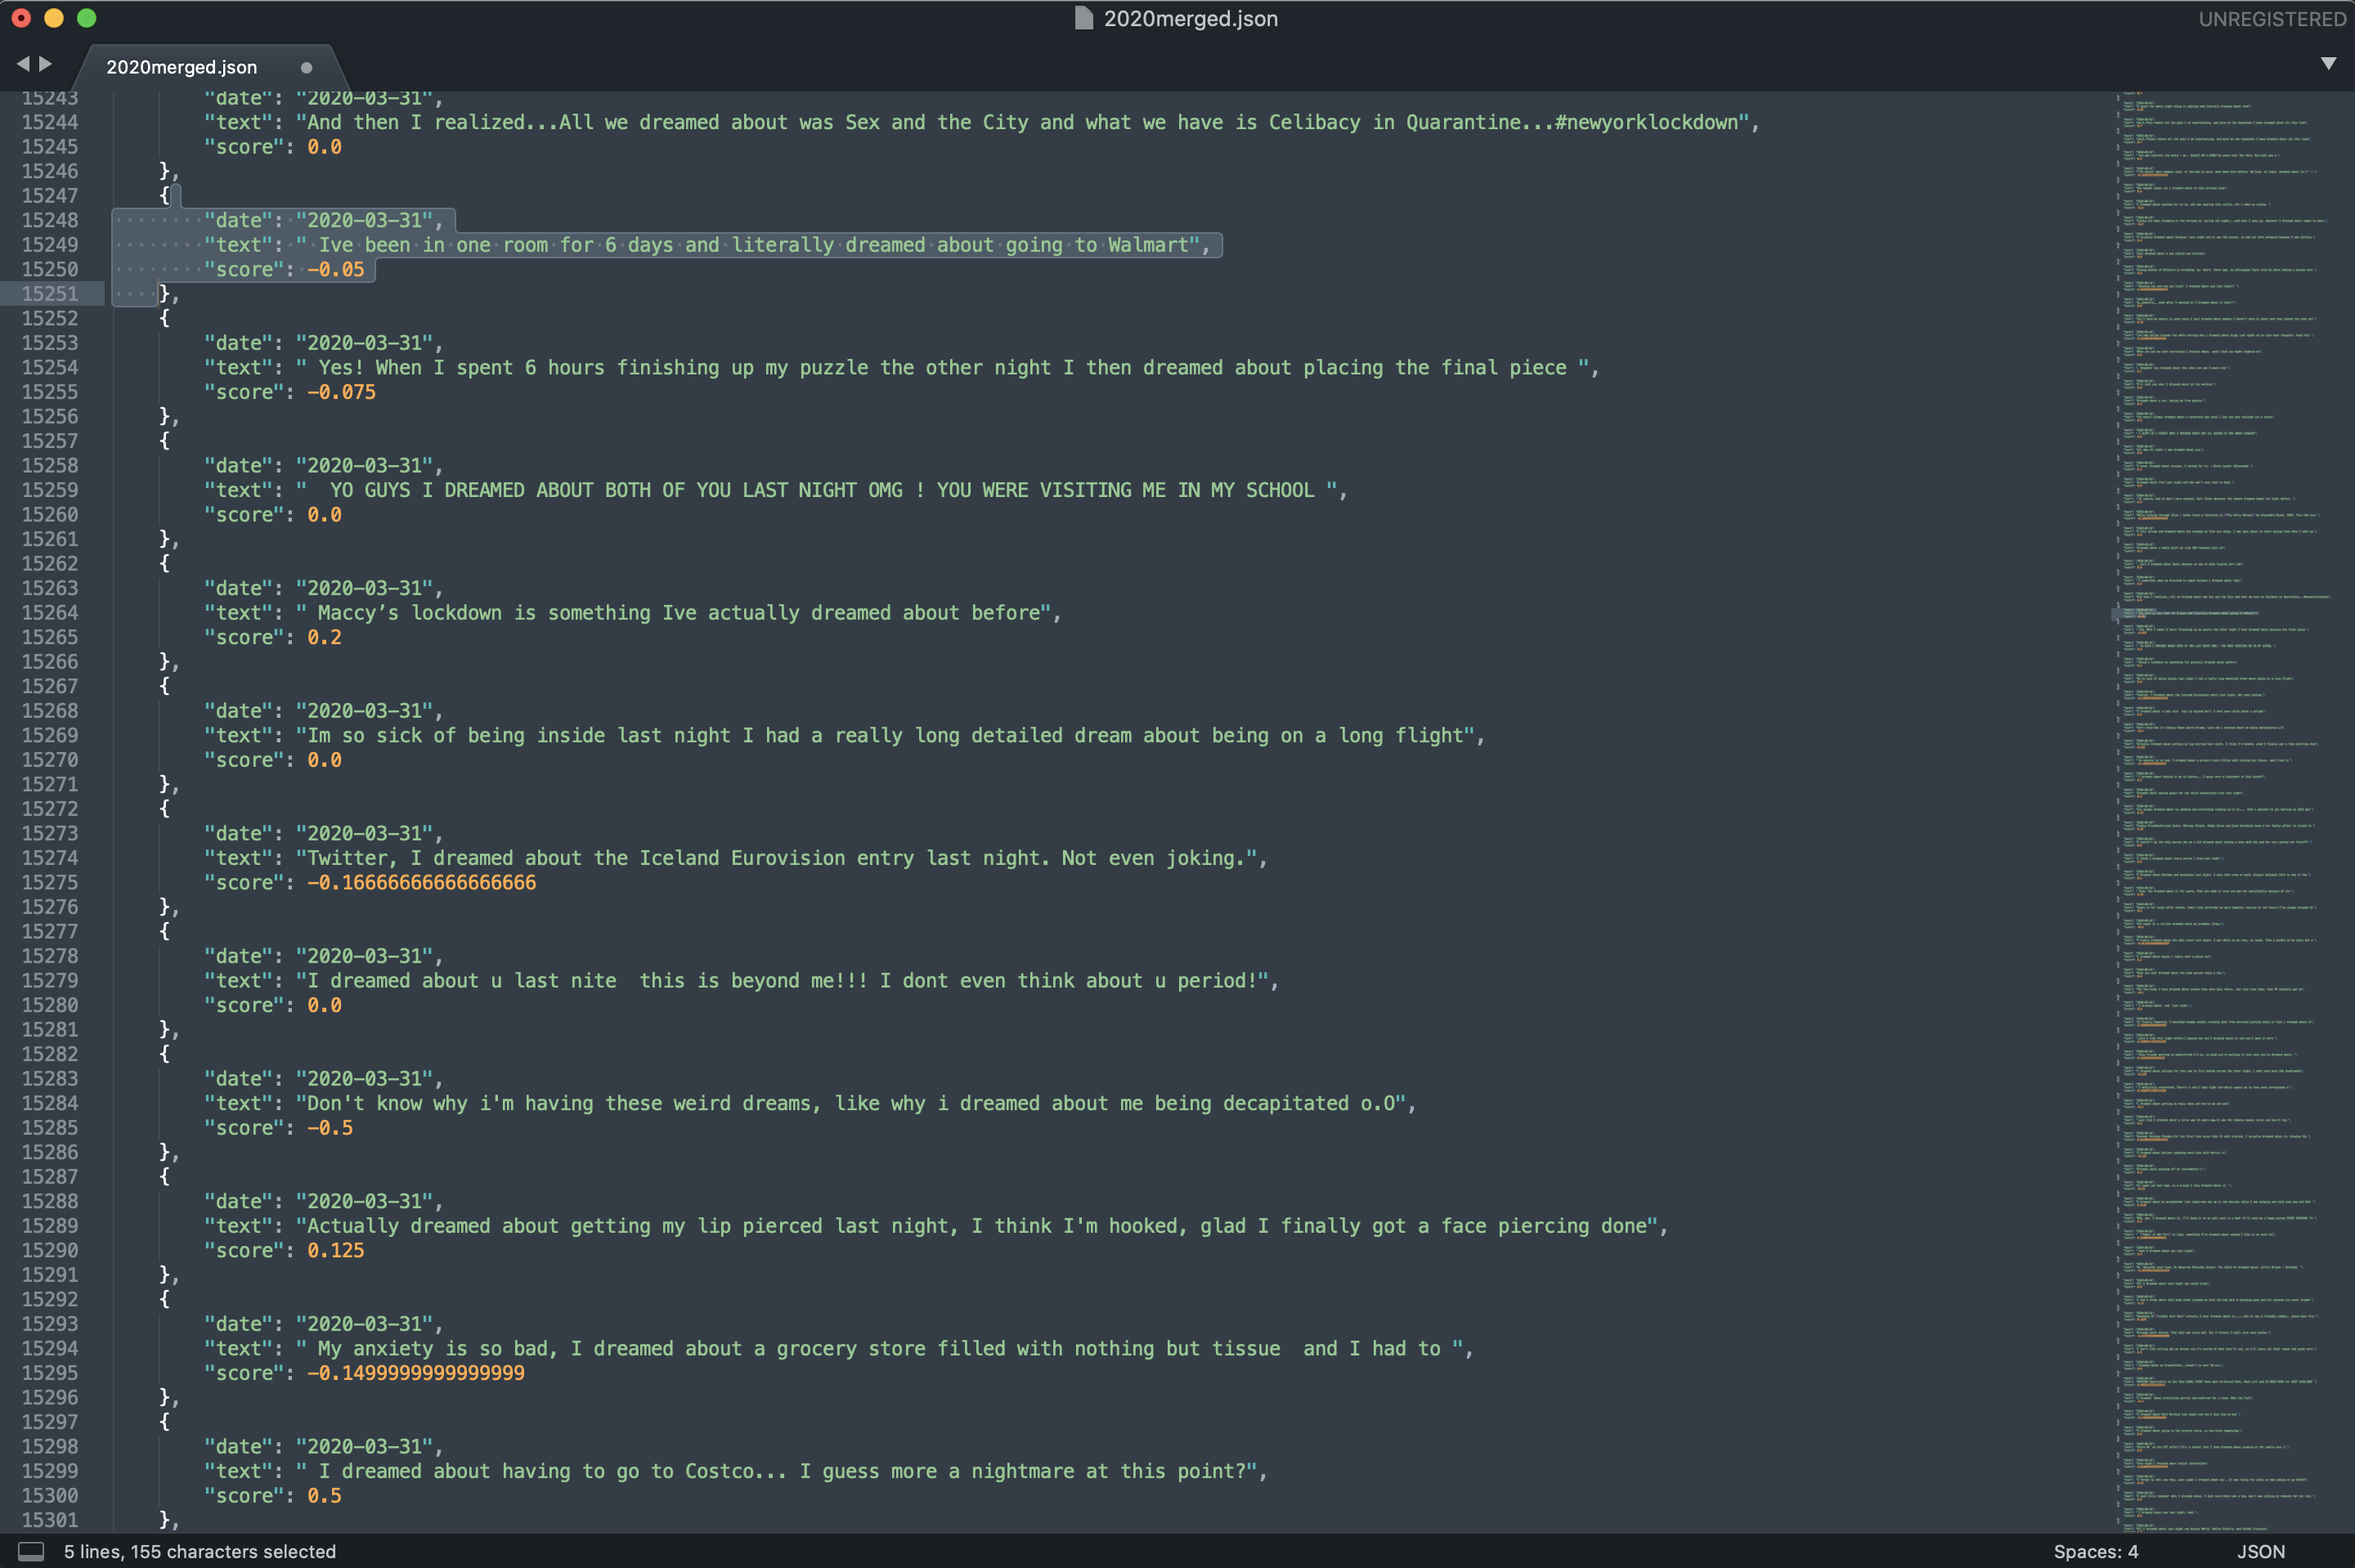
The method for creating the data visualization is to use twitter API to gather tweets related to dreams. I was able to sort the data into three categories: the date, the text, and a sentiment analysis score of the tweet.
Website
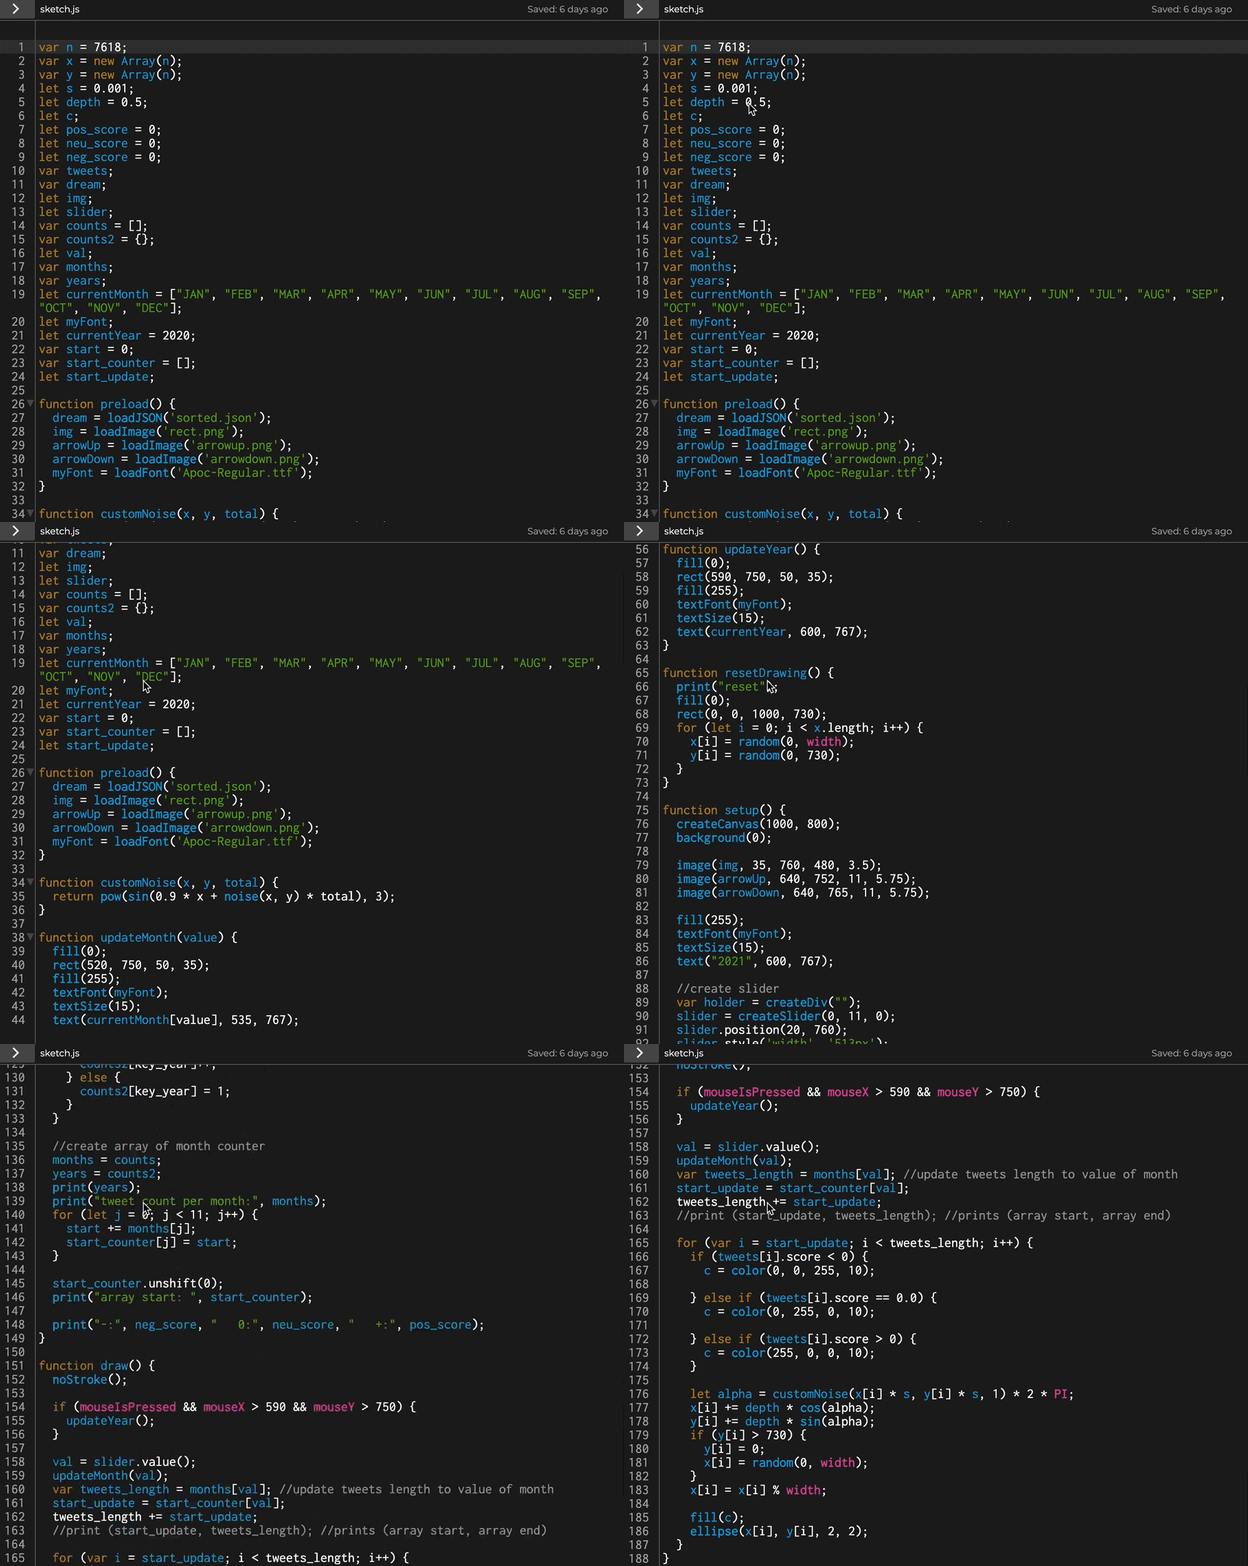
The website framework is inspired by grids and scientific layouts such as a MRI scan report. This is a way to trace the emotional waves of our dreams and current events. Each line that’s drawn represents one tweet, and each color is a feeling. You can navigate through emotions over time by scrolling on the slider at the bottom. In the right columns, the top box displays all the tweets during the month you selected. The middle right box displays the common theme for the dreams of the month.
Turn on sound for the best experience︎︎︎
Turn on sound for the best experience︎︎︎
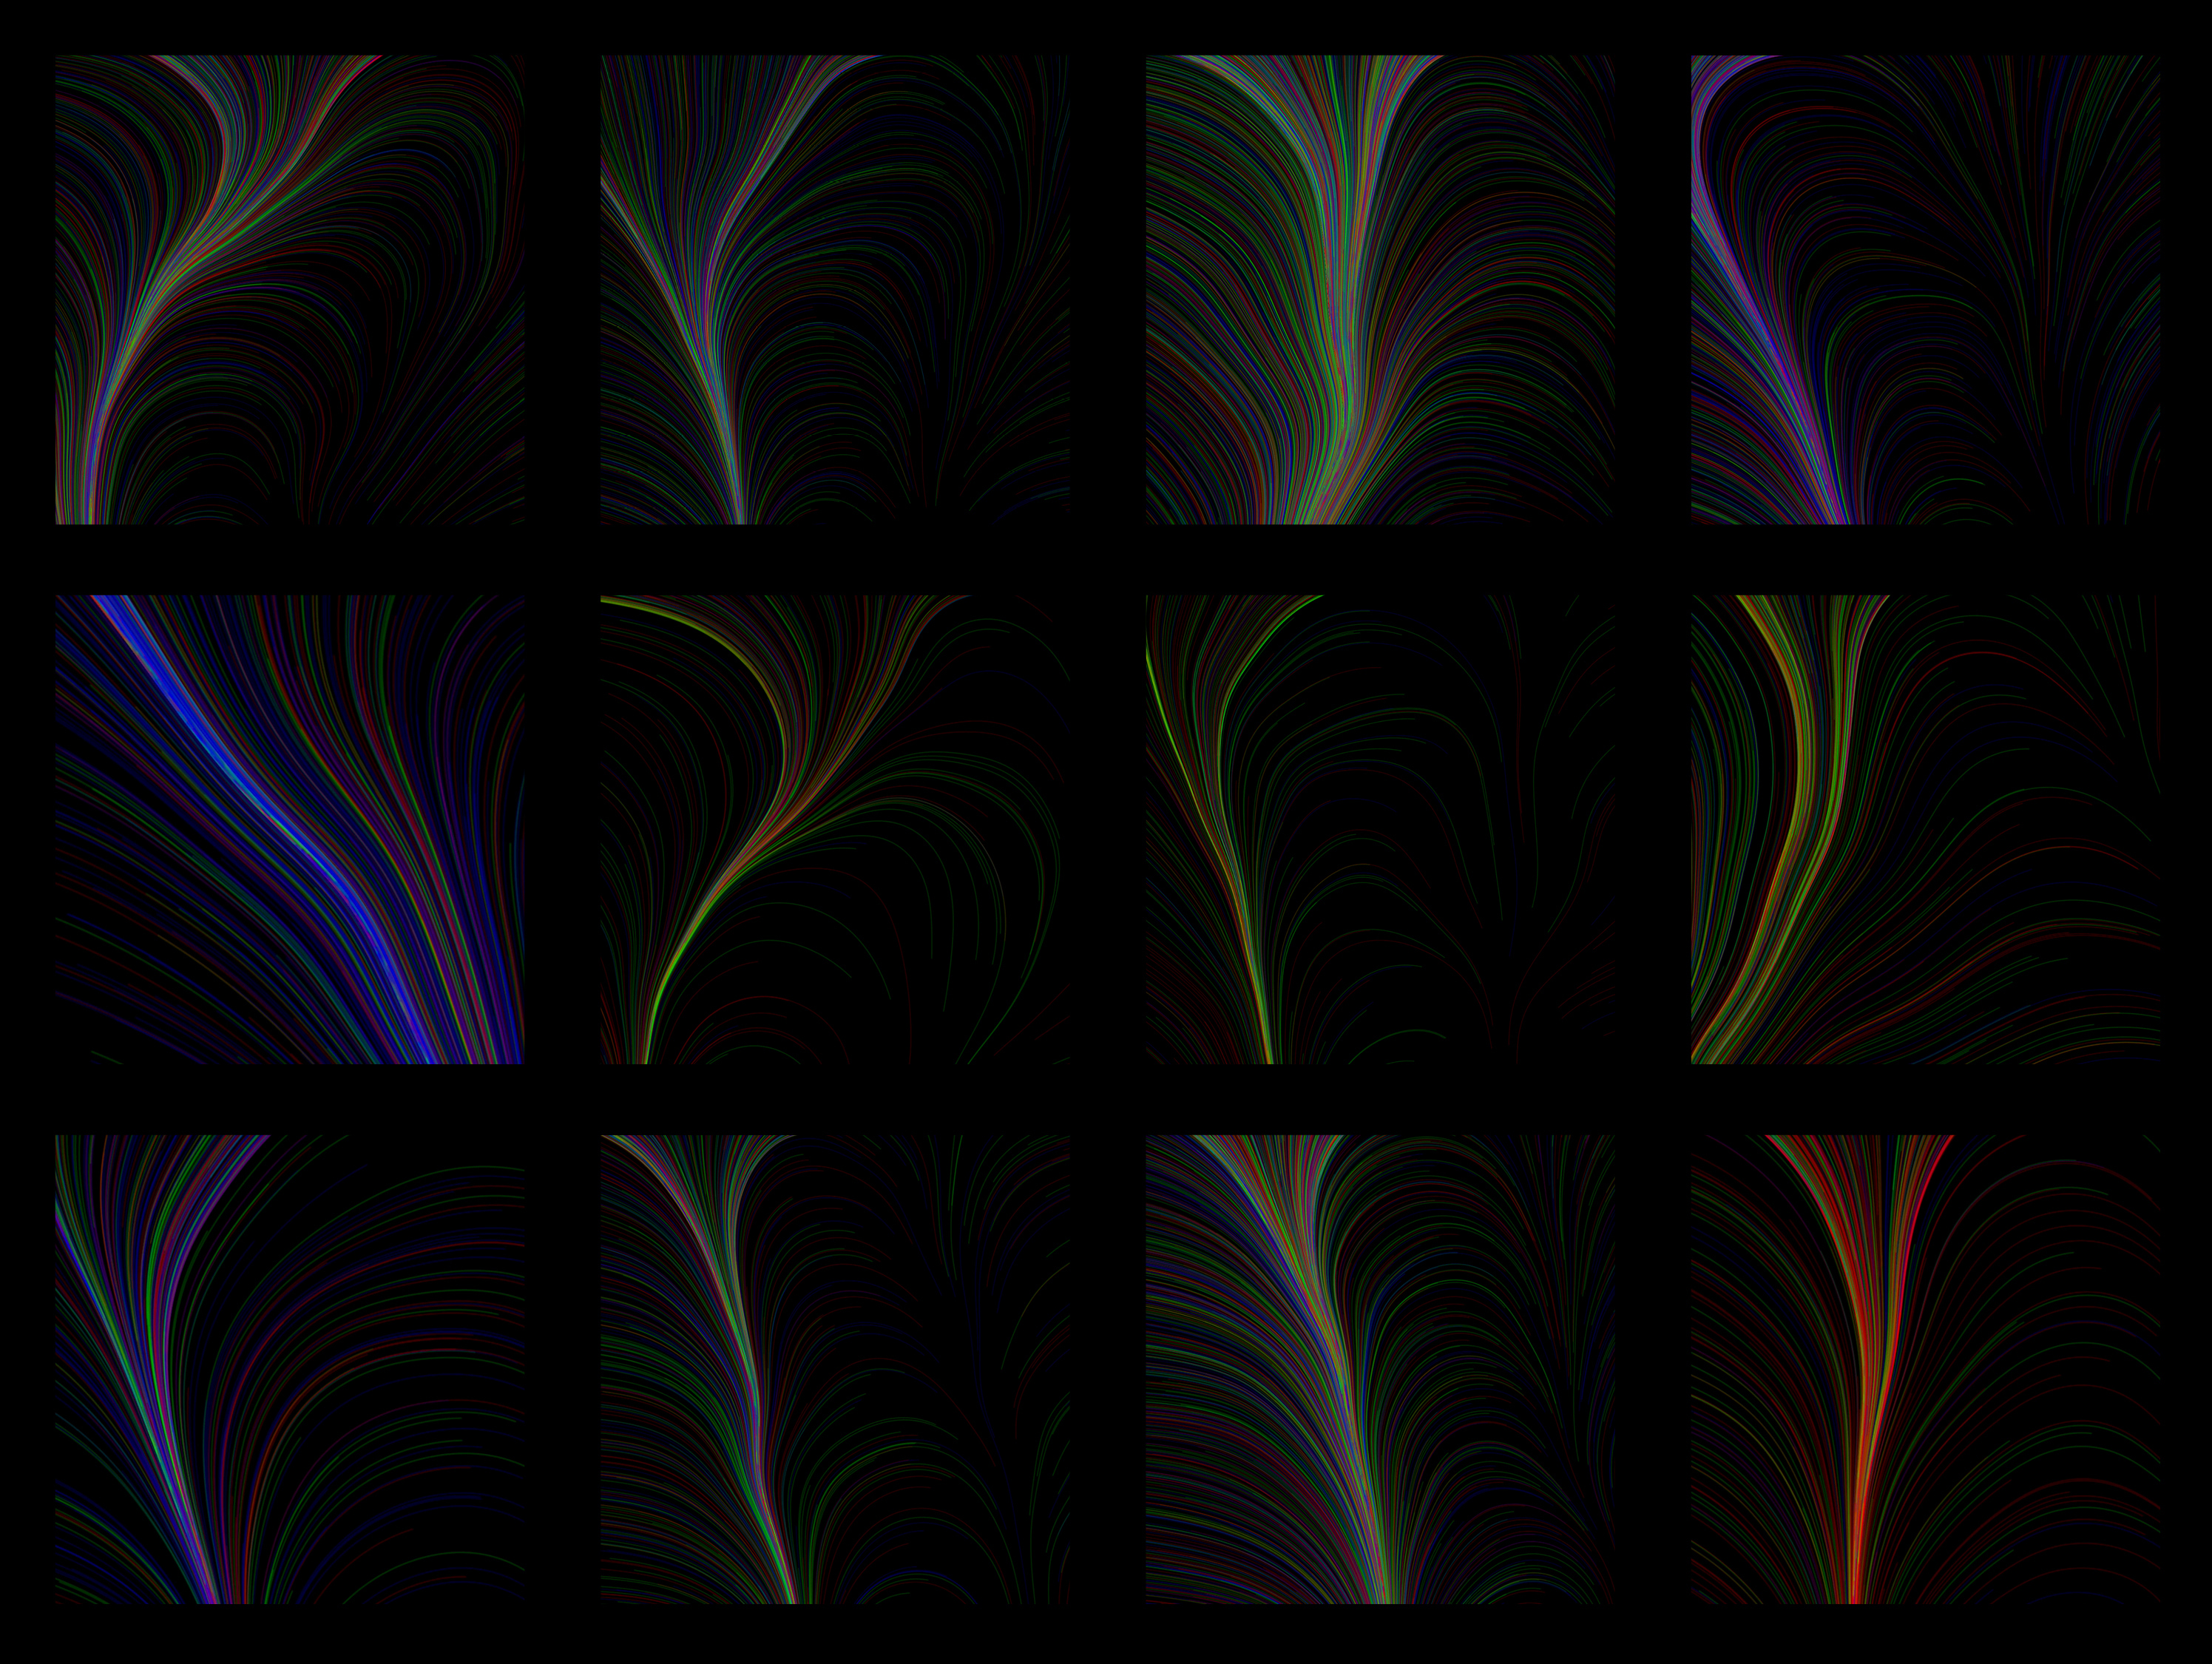
Emotional Waves of 2020
With the website, I was able to trace the our collective emotional waves during 2020. Each of these visuals represent a month in 2020.

Exhibition
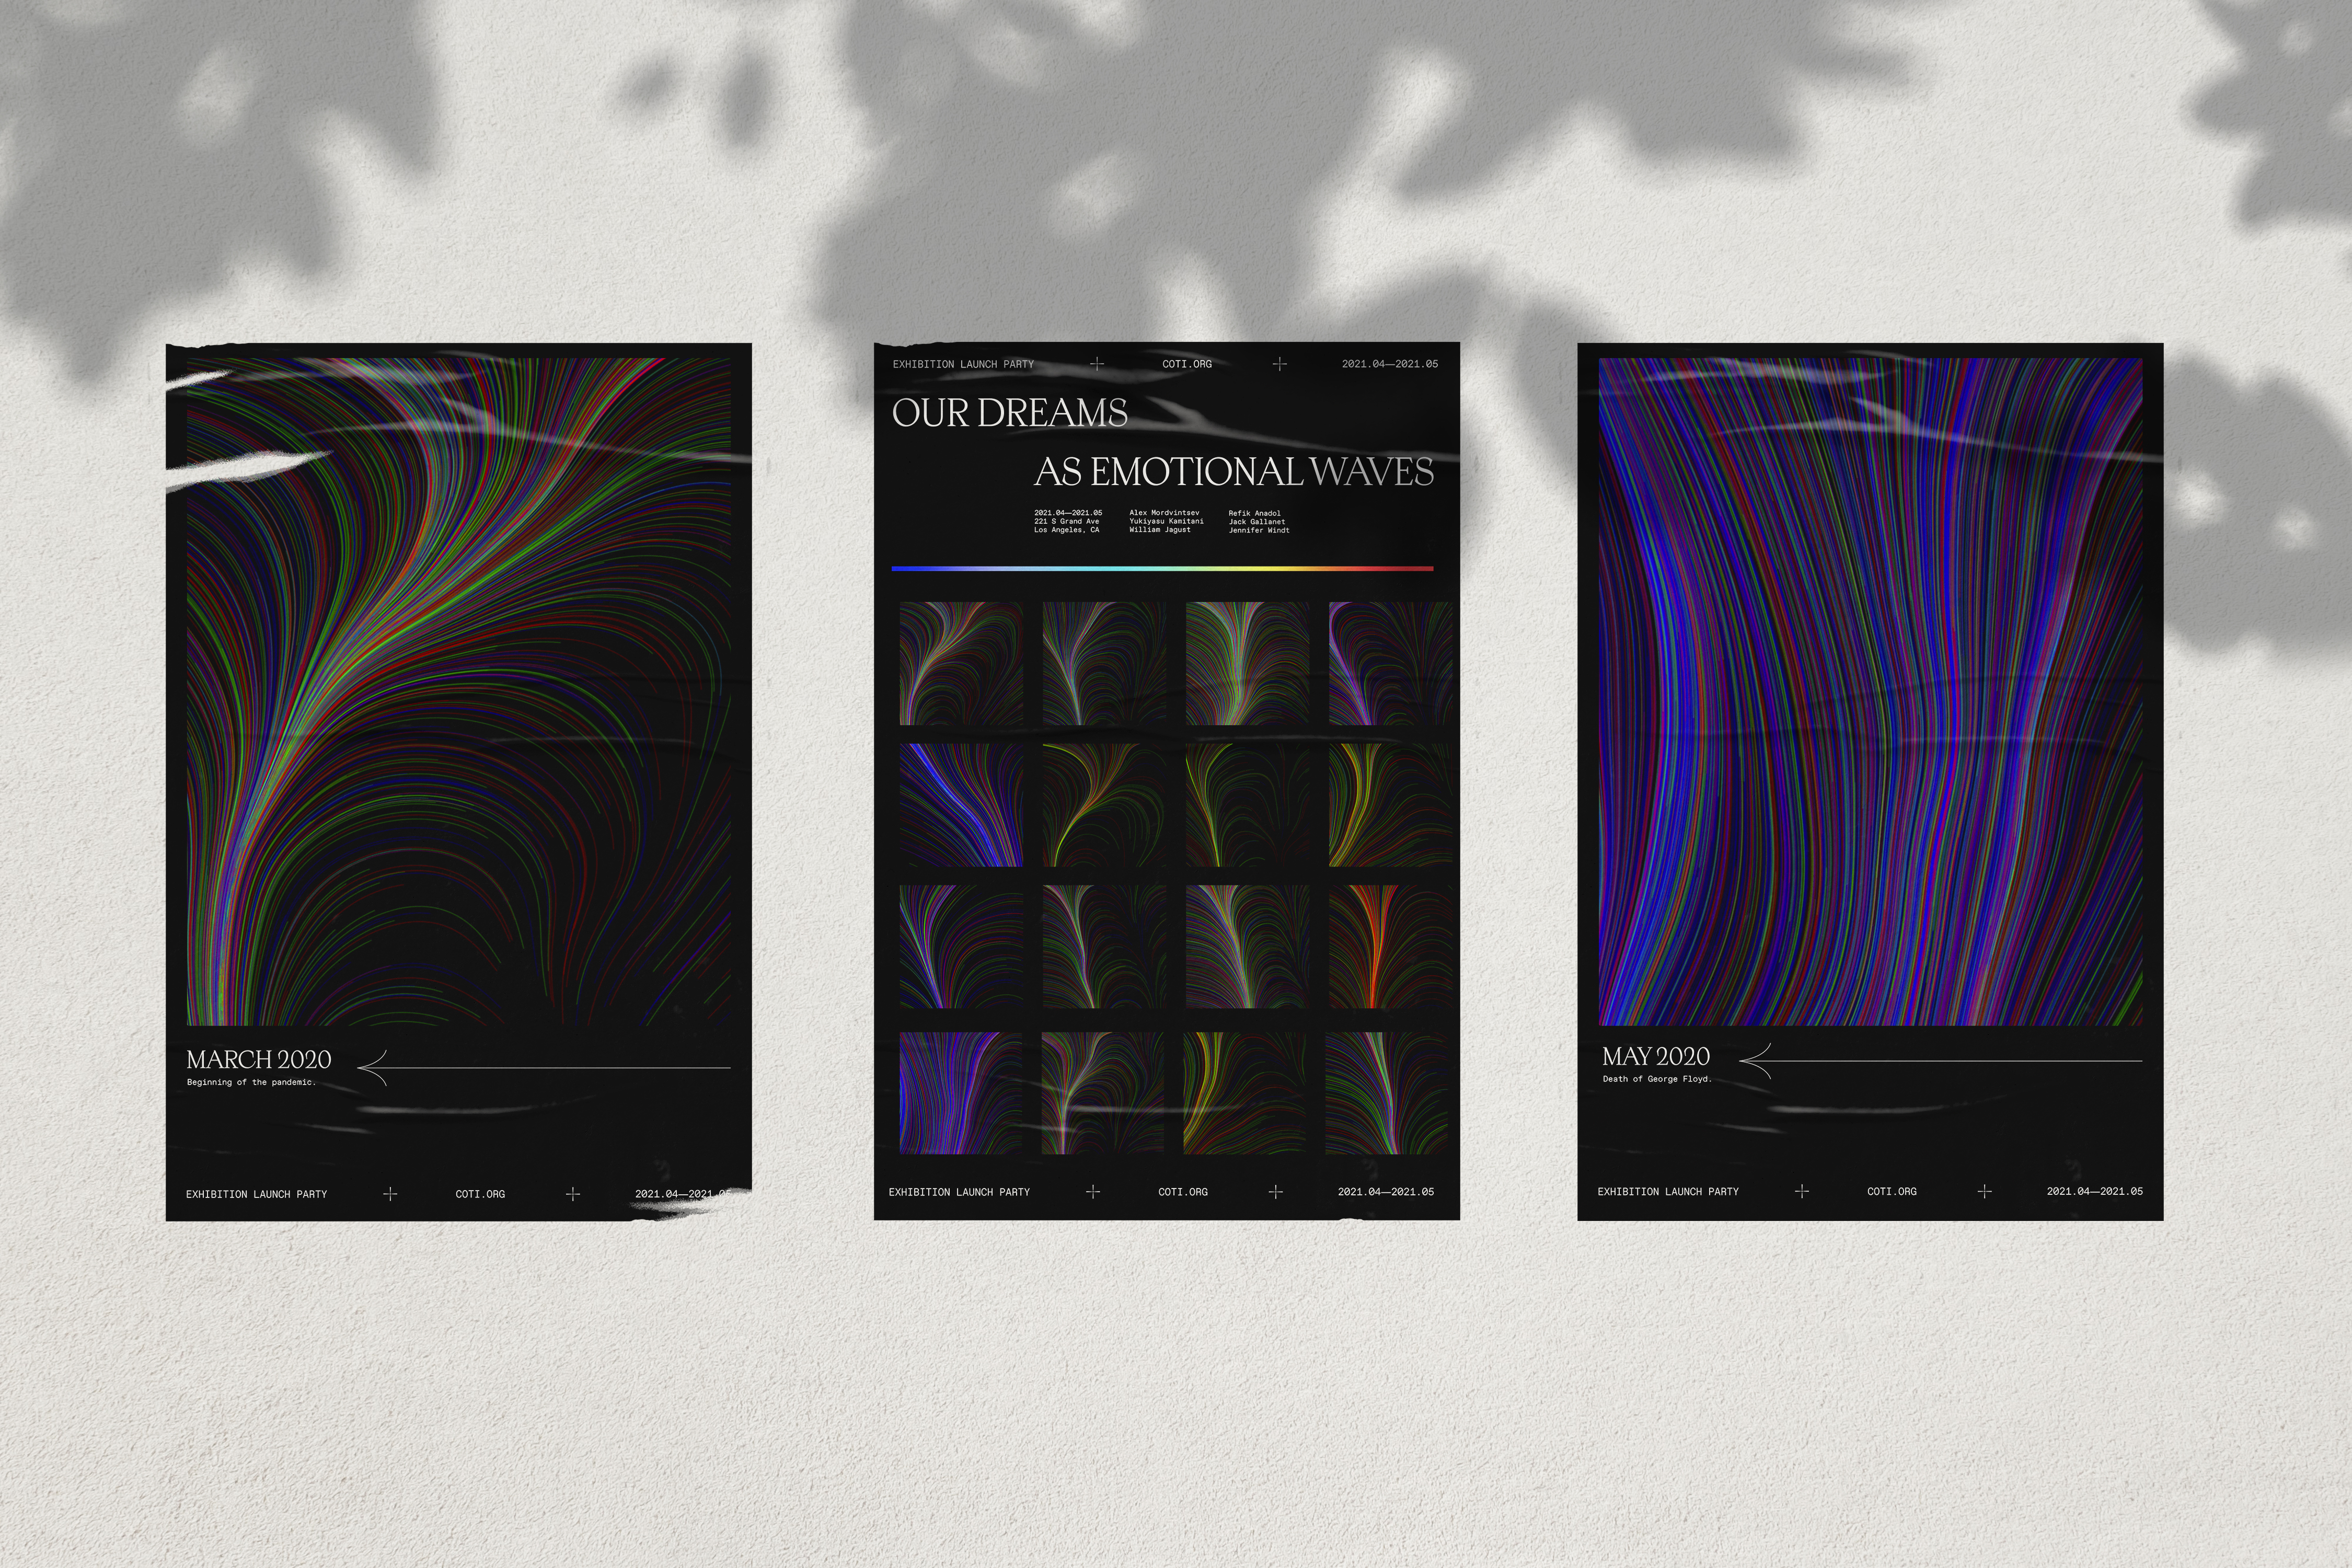
The launch party exhibition will collaborate with Refik Anadol to contribute to Lifespan Human Connectome Project's (HCP) neuroscience research.
Process Book
A documentation of my research progress and a look into the theories of dream sharing.
